Infographic maker for data that lives in your deck
Most infographic makers hand you a poster. You lay the graphic out, export it as a flat image, then paste it into your deck, where nobody can edit it and it quietly stops matching everything around it. Beautiful.ai builds the infographic as a slide instead: arrow bars and diagram layouts that realign as you type, colors that follow your Theme, and a graphic you can still change the morning of the meeting. When the deck travels, it exports to PowerPoint, PDF, or Google Slides with the slides still editable.

An infographic maker built for presentations
Three things change once the infographic is a slide in your deck.
An infographic that behaves like a slide
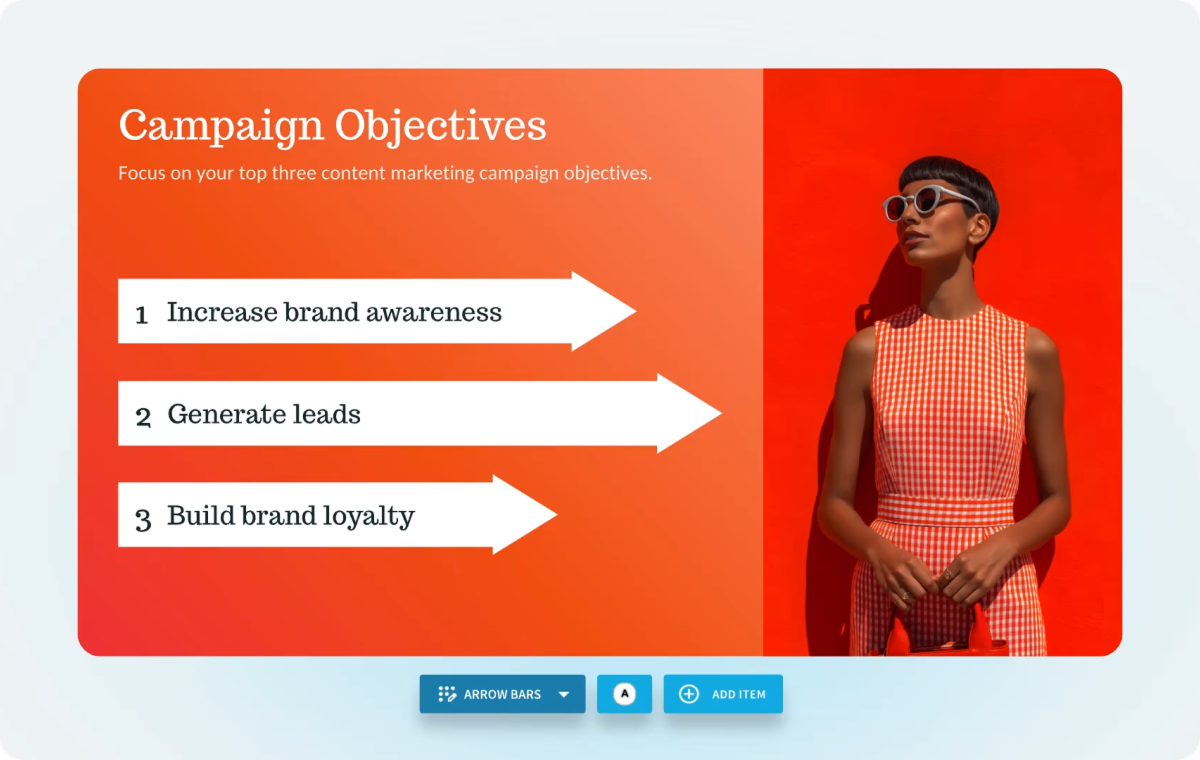
The Infographic Slide organizes your data with arrow bars, so a plain list becomes something that shows steps in a process or relationships between data points. Add or cut a point and the layout realigns and resizes on its own, with no text boxes to nudge back into place. It stays a working slide the whole time, which means the version you present is the version you can still edit.
Design that stays on brand
Set your colors, fonts, logos, and icons once and apply it to any deck. Custom colors reach backgrounds, text, charts, and accents, so an infographic picks up your palette the moment you drop it in, with no recoloring by hand. Smart Slide previews update instantly, so you can see the graphic in your brand’s styling before you commit to it.
AI and 300+ layouts behind every chart
Beautiful.ai carries over 300 Smart Slide layouts covering data, comparisons, timelines, and image grids, so the right shape for your information usually already exists. On an infographic slide, AI can summarize the data, find trends and relationships inside it, refine the copy, and create a supporting image. Start from a prompt, an outline, or your own source material and review the slide-by-slide outline before any slides get generated.
How to create an infographic in Beautiful.ai
Three steps from blank slide to presentation-ready process. No design skills required.
1
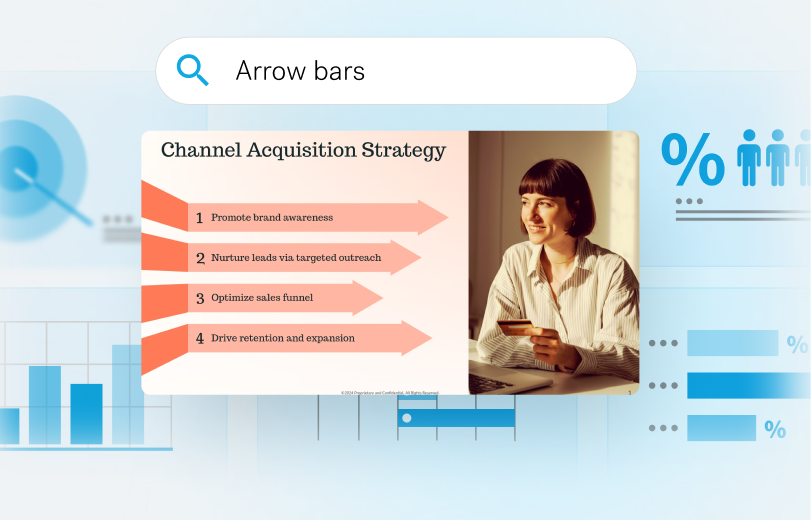
Start with the infographic template
Add the Infographic Slide to your deck and you get the arrow-bar structure ready to fill. If your information is shaped differently, the same library holds Horizontal Funnel, The Arrow Cycle, Connection Diagrams, Sequence, Pyramid, Target Slide, Hub and Spoke, and Cycle Slide.
2
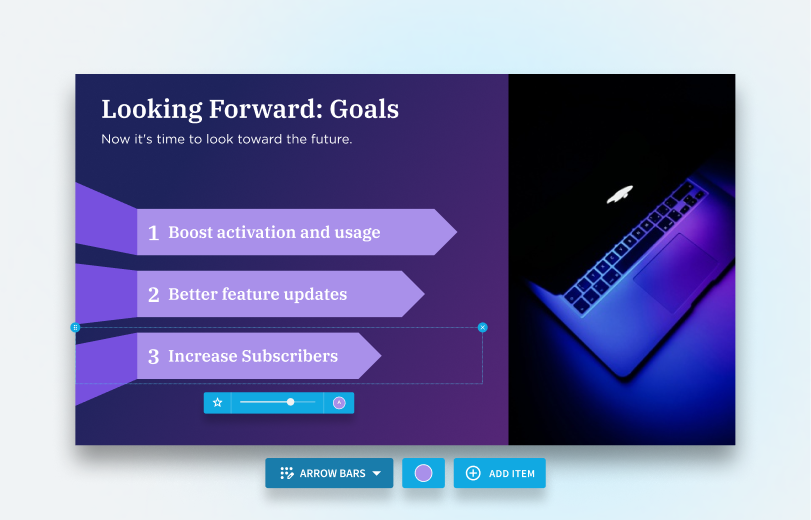
Add your content and let the layout adjust
Type your points in. The Smart Slide design logic auto-adjusts spacing, text, and visuals as you edit, so adding a fifth step to a four-step graphic re-spaces the whole thing and keeps it intact. AI can summarize the data or surface the trends and relationships in it if you are still working out what the graphic should say.
3
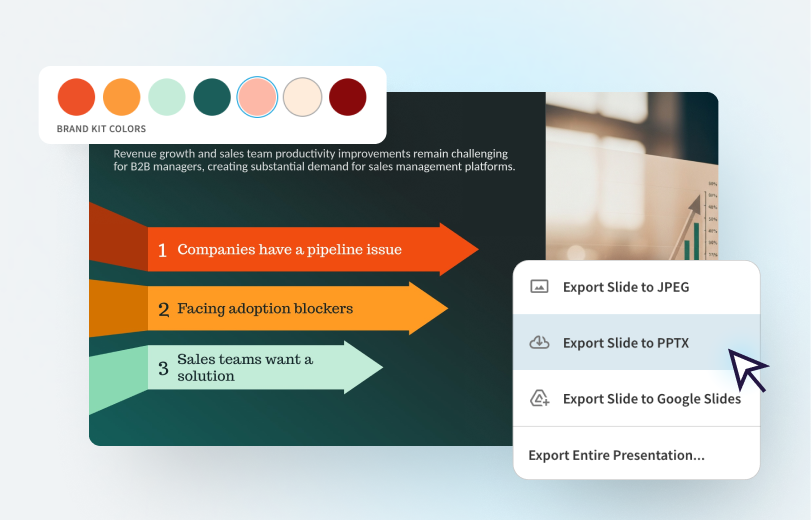
Style it, present it, export it
Apply your Brand Kit so the colors and fonts match the rest of the deck, then present it in Beautiful.ai. When the deck needs to leave, export it as a PowerPoint or PDF file with layouts and design integrity intact, and slides that stay fully editable on the other side.
Frequently asked questions
Add the Infographic Slide to a deck, type your data points in, and let the layout realign as you go. Apply your Brand Kit so it matches the rest of the presentation, then present it or export it. The three steps above walk through it in full.
An infographic presents information visually so a reader can take in the shape of it before reading a word: a sequence of steps, a comparison, a hierarchy, or a set of figures with the relationships between them made explicit. In a presentation, its job is to let an audience follow your point at a glance while you talk.
AI can summarize the data on an infographic slide, find trends and relationships inside it, refine the copy, and create a supporting image. You can also start a whole deck from a prompt, a pasted outline, or your own source material, and review the slide-by-slide outline before any slides are generated.
Yes. You can export any Beautiful.ai Smart Slide as an image from slide export menu. Go to 'Manage' on your properties panel, then click on 'Export Slide' which will open the opens for export. You can choose to 'Export Slide to Jpeg' to download it as an image.
Process and step sequences with the Infographic Slide or Sequence, cycles with The Arrow Cycle or Cycle, hierarchies with Pyramid or Hub and Spoke, funnels with Horizontal Funnel, and relationship maps with Connection Diagrams. For number-led graphics, the Data and Chart slide templates cover bar charts, line charts, and dashboards.
There is no free plan. Beautiful.ai runs a 14-day free trial of the Pro or Team plan, which includes the Infographic Slide and every other Smart Slide layout, and Pro is $14.50 per month after the trial. If you need a free tool for a one-off graphic, several of the standalone infographic makers offer one.
Yes. Export any presentation as a PowerPoint (.pptx) or PDF file, with your layouts and design integrity intact. Slides remain fully editable after export, so the infographic arrives as a working slide rather than a pasted picture. Google Slides downloads are available too.
When the infographic is the finished artifact rather than part of a presentation. A standalone graphic for a blog post, a social feed, or a print handout is what tools like Canva, Venngage, and Piktochart are built around, and each of them downloads the finished result as an image file for exactly that. Beautiful.ai is the better fit when the graphic has to live in a deck, stay on brand with the slides around it, and still be editable when the numbers change.

Turn your next infographic into a presentation.
Make it once, keep it on brand, and present it beautifully. Try Beautiful.ai free for 14 days.
