Product Updates
Welcome to our changelog. We're making it super easy to keep you updated on the latest releases, bug fixes and product updates.


Five new Smart Slides for faster storytelling
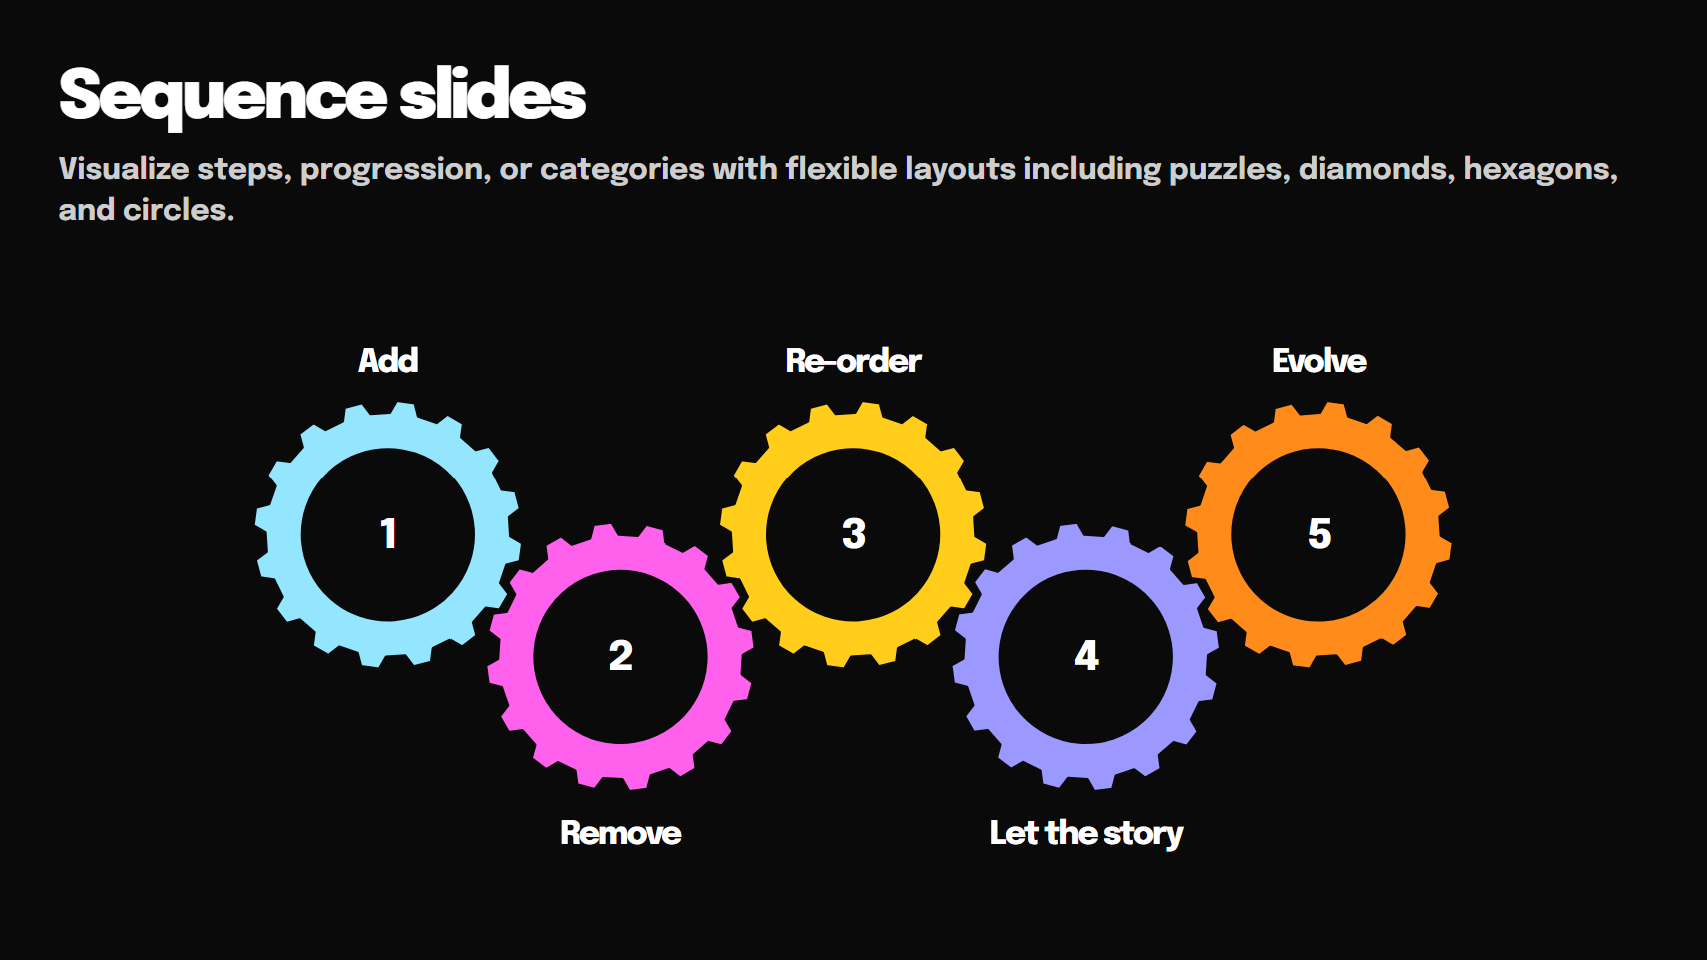
Sequence slides
Visualize steps, progression, or categories with flexible layouts including puzzles, diamonds, hexagons, and circles.
Add, remove, or reorder items as your story evolves and Smart Slides automatically keep everything aligned.
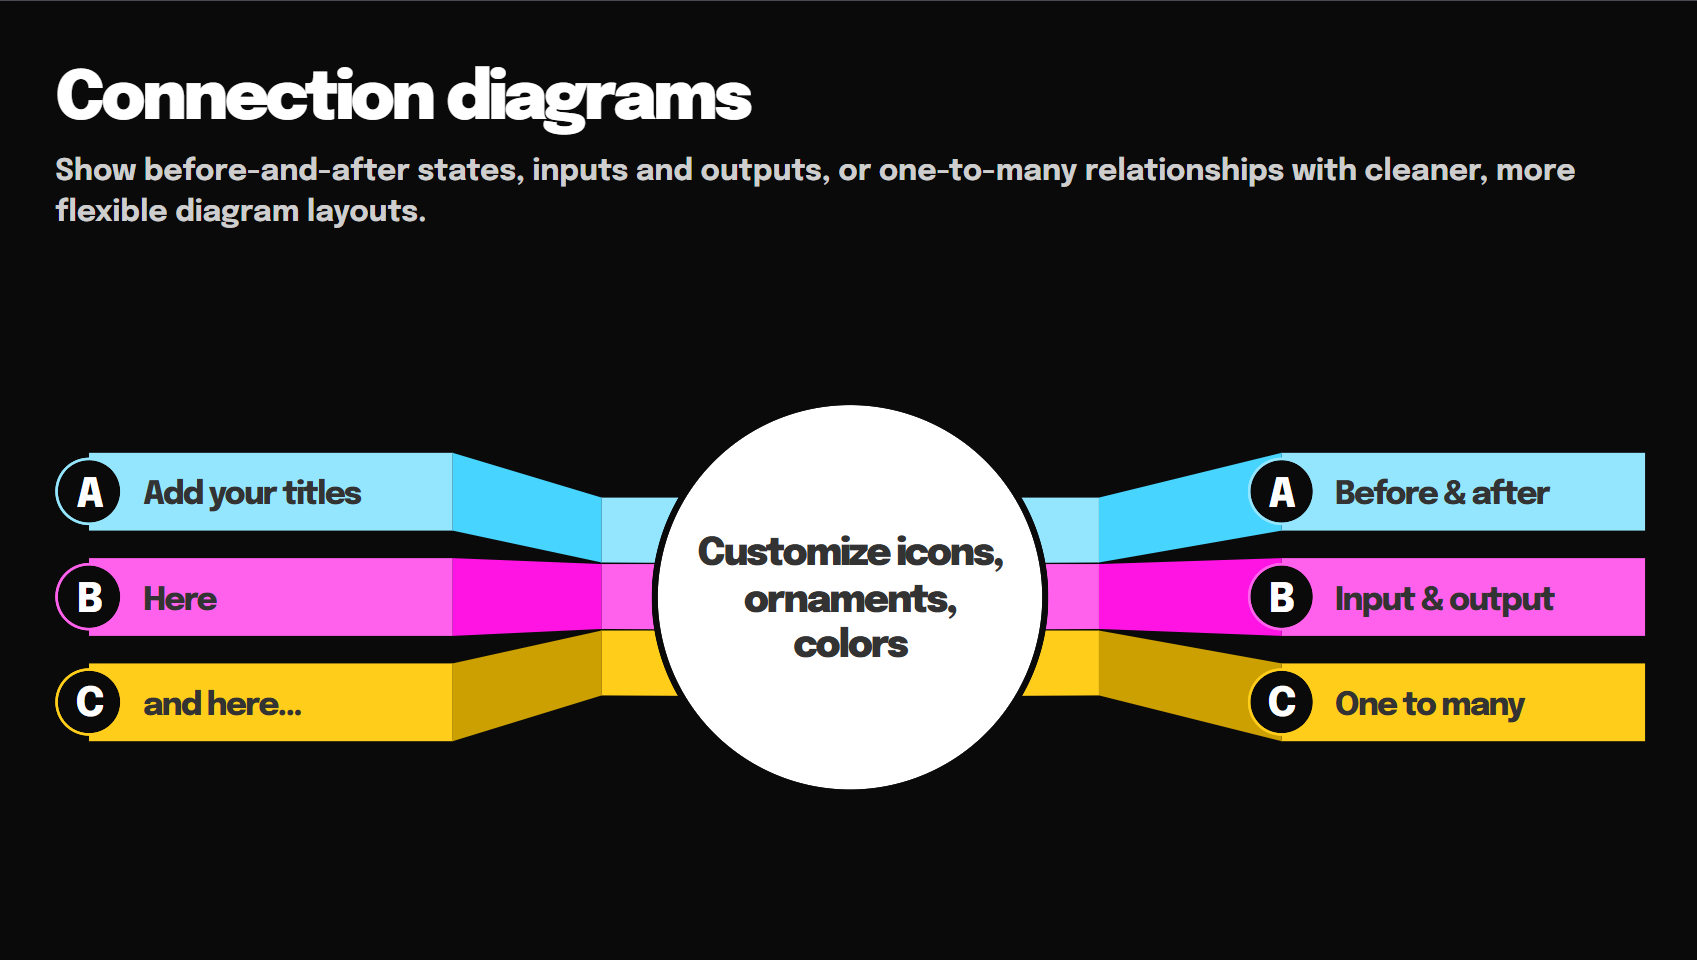
Connection diagrams
Show before-and-after states, inputs and outputs, or one-to-many relationships with cleaner, more flexible diagram layouts.
Customize icons, ornaments, colors, and full-bleed styles to match your presentation.
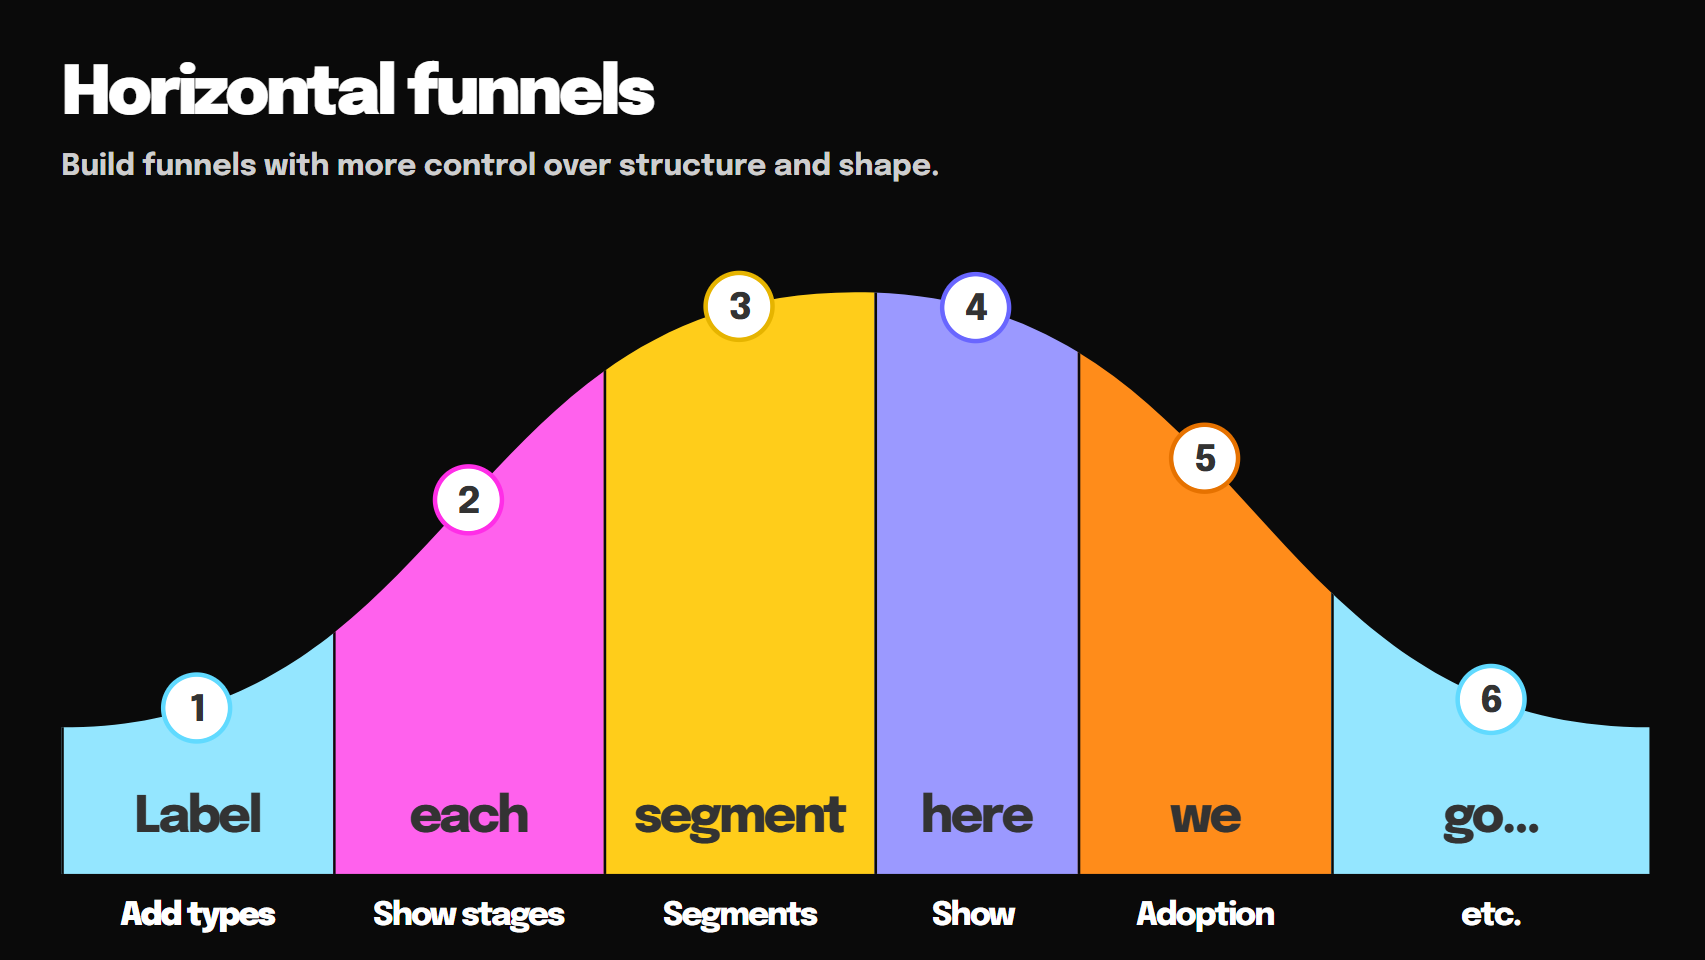
Horizontal funnels
Build funnels with more control over structure and shape.
Add or remove sections, reorder stages, apply supporting text, and customize curves for a more tailored visual.
Perfect for sales pipelines, lifecycle stages, and conversion reporting.
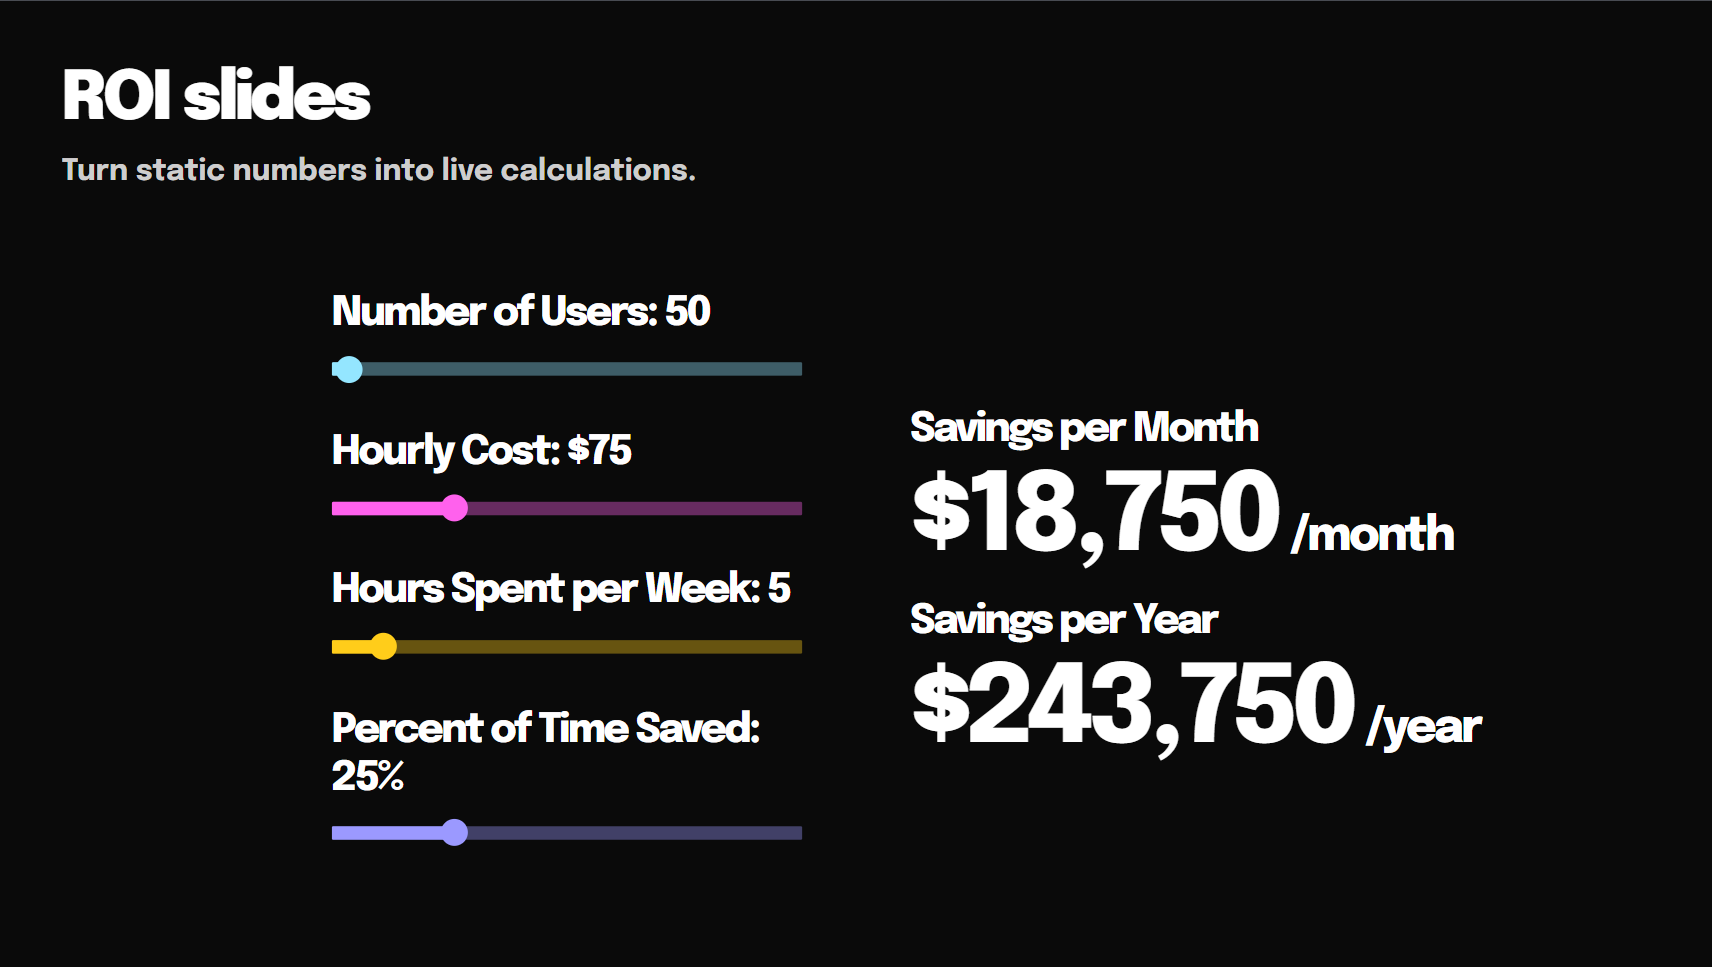
ROI slides
Turn static numbers into live calculations.
Set variables, build your logic, and adjust sliders during playback to update results in real time. A faster, more dynamic way to present value and model scenarios live.
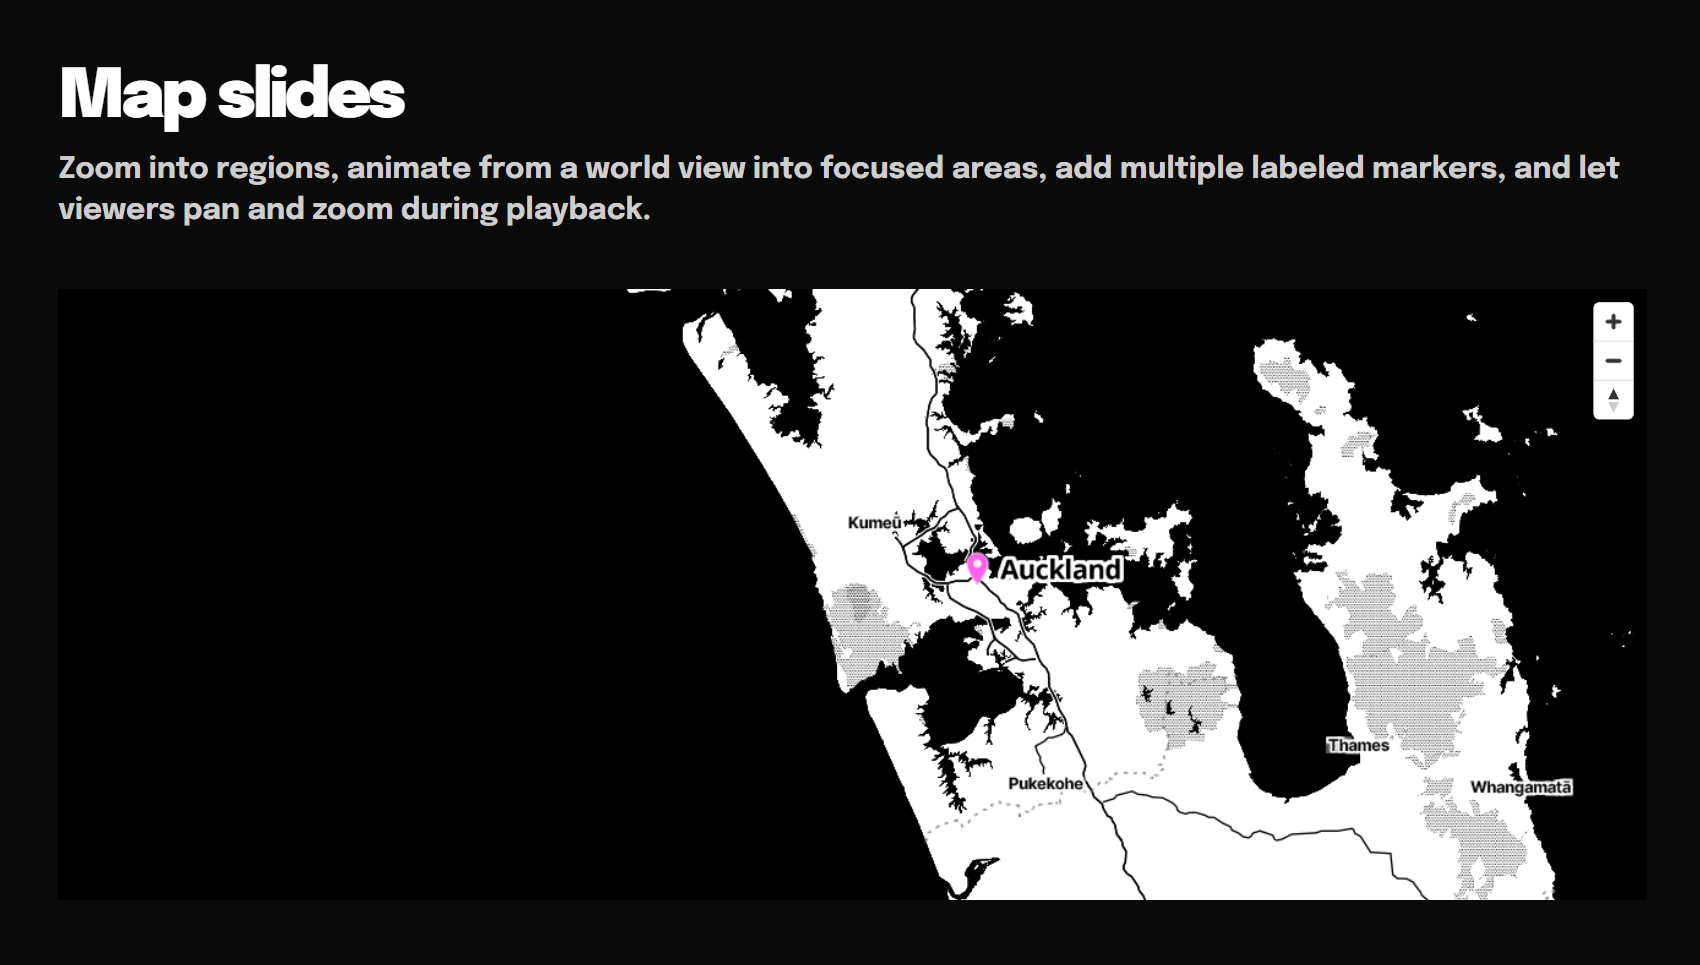
Map slides
Map slides are now far more presentation-ready.
Zoom into regions, animate from a world view into focused areas, add multiple labeled markers, and let viewers pan and zoom during playback.
Perfect for regional reporting, expansion plans, and customer storytelling.
These new Smart Slides are designed to help you spend less time formatting and more time presenting ideas clearly, confidently, and beautifully.
Major product release! Create with AI workflow
Introducing Beautiful.ai 3.0, the Create with AI Workflow. This is AI that (finally) creates what you asked for.
When generative AI first hit presentations, it felt like magic: instant slides, instant copy, instant images. But for most teams, the ‘wow’ wore off fast. The outputs weren’t quite usable, the story drifted, the details changed. You ended up with a deck you couldn't actually use. Today, we’re sharing a major step forward in AI presentation creation.
This isn’t AI that just generates a deck based loosely on a prompt. It’s AI that helps you create one, all while staying true to your context, your intent, your asks. Here’s what AI creation now means with Beautiful.ai:
- AI that’s faster, smarter, and more flexible
- Slides that reflect what you actually asked for
- The ability to shape the story in stages
- Instant visual ideation and design iteration
- More options, more control, better results
- Getting to work-ready presentations faster than ever
The goal is simple. Beautiful.ai now gets closer to what you envisioned in your head, the first time. Get to polished slides faster, with the right text, layouts, and full visual control.

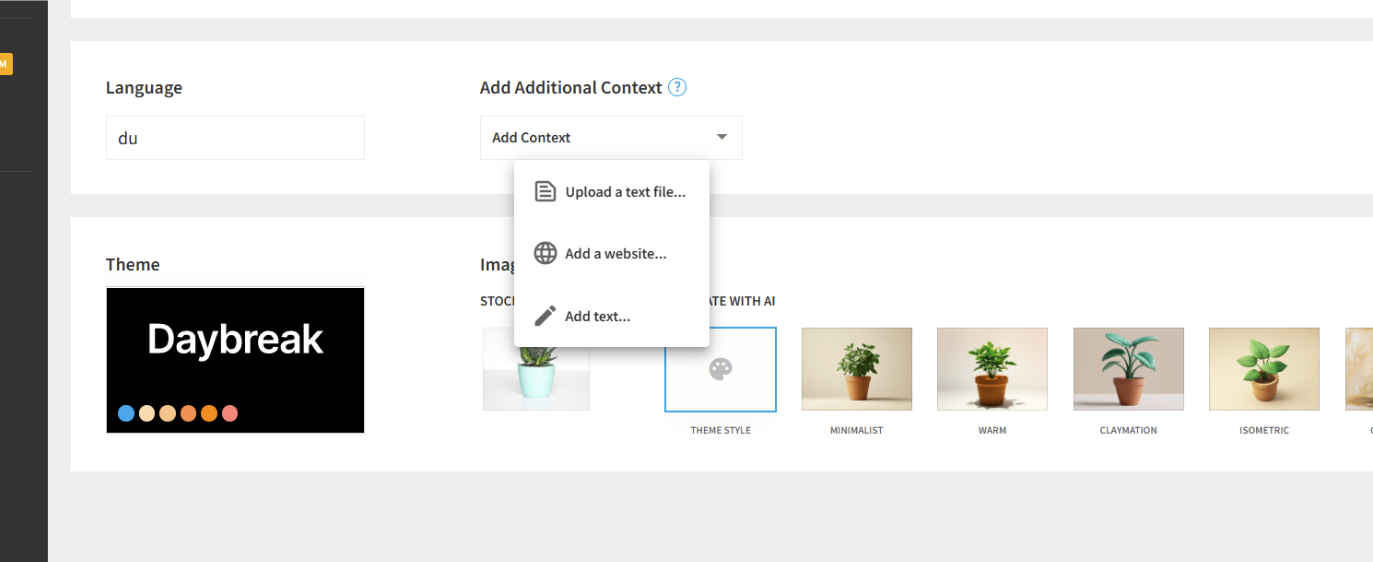
Improved AI images
We’ve rolled out significant improvements to the AI generation flow, focused on clarity, control, AI image creation, and theme selection. These changes are designed to make the first few minutes with our AI feel more intuitive, and visually delightful.
Optional AI image generation. The biggest change to the interface and the outputs are images. Users can now choose to generate custom images with AI as part of their deck generation. Users will see options with example previews to select an image styling.
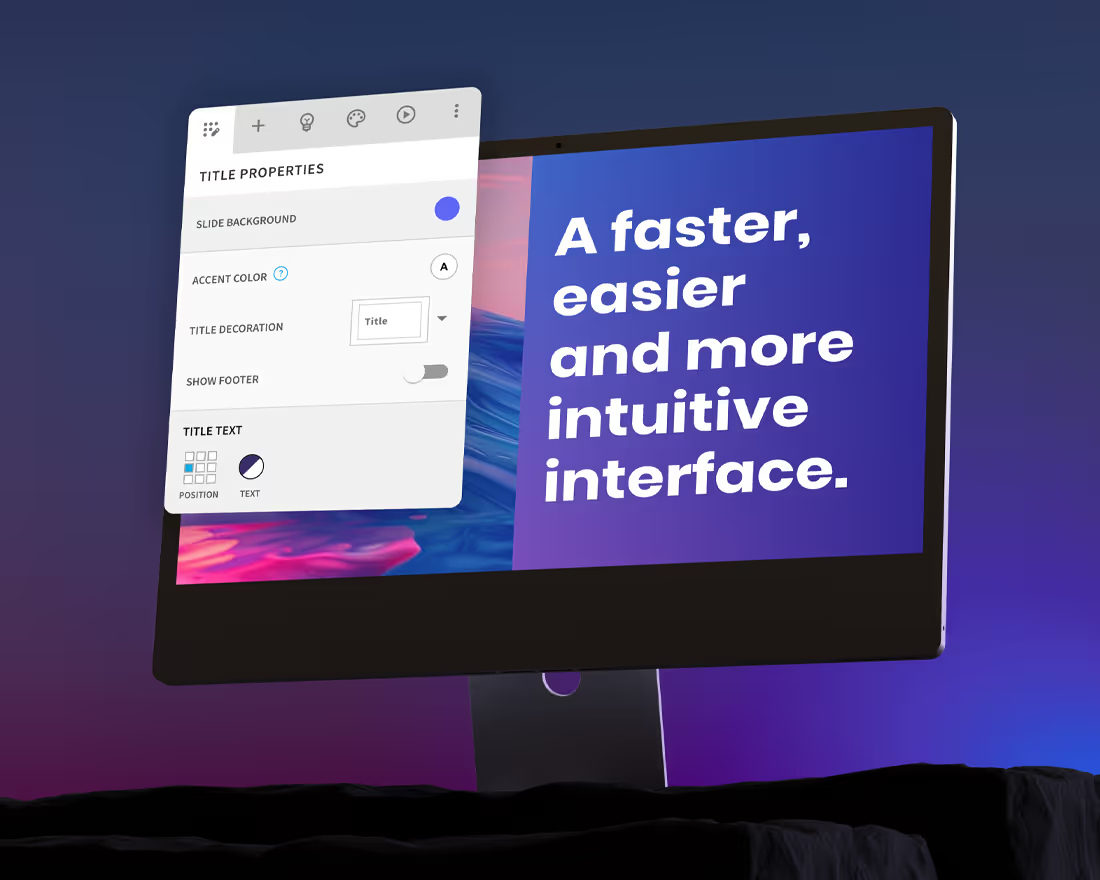
New slide editor
We’ve refreshed key parts of the Beautiful.ai editor to reduce ‘where is that?’ moments and to help you move faster.
What’s changed (and why it’s better):
- Slide navigation on the left: See your story at a glance, drag to reorder, and stay oriented without switching views.
- Edit in place: The blue controls under each slide surface the major components of that Smart Slide (what’s unique to that layout). Click to adjust right in context.
- Familiar, deeper settings: Click 'edit' to open the Properties Panel you’re familiar with, it’s just now on the right.
- Cleaner wayfinding: Home navigation, presentation settings, and theme are cleaner to view in the top bar for quicker access.
- Consolidated tools: The right toolbar groups editing, collaboration, and slide management in one predictable place.
- Make it yours: Choose light or dark mode, and keep the Properties Panel open or closed as you prefer.

💡 Want to read more about what’s changed? Learn more here
How to create a collection color palette
- Open the Style Panel and click Edit Theme.
- Under Collection Colors, click the multi-color icon to edit or create a palette.
- Add, remove, or reorder colors—or generate a gradient by picking a start and end color.
Once you've updated your theme, try it on a multi-item slide (like a Target Slide) to see it in action. You’ll also notice new style options—like shaded effects that apply light-to-dark gradients and expanded support for styles like Muted, Outlined, and Fill across more Smart Slides.
💡 Need a refresher on Beautiful.ai themes and branding? Learn more here
Find and replace
Our new Find & Replace feature is designed to help you efficiently manage text across your entire presentation. This powerful addition saves you valuable time when updating terminology, fixing typos, or making consistent text changes.
Here's how:
- Open the find replace panel—either by hitting ctrl+f/cmd+f, or locating it in the property panel under "Options"
- Enter the text you want to find in the "Find" field
- Easily scroll through instances across your deck
- Optionally enter replacement text in the "Replace with" field
- Choose to replace all instances in one click, or review the results and replace individual instances
.avif)
Smarter, faster workflows
AI and Automation
Reduce repetitive tasks and boost productivity with the help of AI and built-in intelligence.
Expanded AI Support
Generate content for more Smart Slides including Journey, Target, Waterfall Chart, Area Chart, Hub and Spoke Diagram, Cycle Diagram, Arrow Bars, Word Cloud, SWOT Diagram, and Gantt Chart.
Automatic Naming
New presentations are now named for you—no more “Untitled.”
Slide Trash Cleanup
Clean up your workspace by emptying the Slide Trash and permanently deleting old slides.
What's New for Teams
Built-in control and flexibility to help you manage your team’s content and keep presentations on-brand.
Delete Shared Slides
Delete Shared Slides from Team Resources—even if they’re already in use. They’ll remain in the deck but become fully editable and unlinked from the original.
Multi-select Shared Slides
Add multiple Shared Slides to your presentation in a single click.
Restrict Export
Prevent team members from exporting to PowerPoint, Google Slides, PDF or as an image—ensuring your company content is all in one place and up to date. Keep animations, brand guardrails, and analytics intact by ensuring your team is sharing via Beautiful.ai viewer links. Choose who on your team has access to export features in your Brand Guardrails.
A new version of Beautiful.ai
We've made your Beautiful.ai editing experience more powerful, flexible and easier to navigate. Here's what to expect:
- Configure slides from one, easy to navigate panel
- Expanded slide functionality and features
- Flexible grids to showcase data, text and images
- More control with new alignment, distribution and selection tools
- New Smart Slides!
The Properties Panel
We've refreshed the editor UI to make it easier to find everything you need to configure your slide. Tools and settings are now organized in a panel with six tabs:
Edit: Configure your slide. Switch between layouts, tweak styles and toggle slide settings. Unique options for each slide are now surfaced in one view.
Add: Add images, logos or supporting text in a click or highlight important points with Callouts. Just drag and drop wherever you need a little extra on your slide.
Ideas: Try another Smart Slide or convert your slide to Classic. Easily find the right visualization for your content.
Style: Edit or switch your presentation theme.
Playback: Customize animations and add audio or video narration.
Options: Create and manage Team Slides, skip slides, open speaker notes, find export options and slide version history.
A More Powerful Dashboard for your Data
Showcase your data, media and text in a flexible grid. Drag cell handles to arrange and create new cells. Click and drag to rearrange content. Add charts, tables and infographics—including radial bars and styled statistics. Dashboards now also support text, images, logos and icons.
Find the same flexibility and simple drag and drop functionality in other Smart Slides as well, including Photo Grid, Carousel, Stack Diagram and slide sidebars and trays. Further customize and style your grids with shape and device frames.

Action Number
Make an impact with this animated number Smart Slide. Choose from a selection of animation styles and preview slide playback in the Properties Panel.

Arrow Cycle
Use this dynamic Smart Slide to display your cycle or process. Add items in a click, and try additional styles and configurations—like puzzle pieces and drop shadows—in the Properties Panel.

Improved Flowchart and Callout Functionality
We've added new keyboard shortcuts and alignment tools to get you to a finished slide faster.
Flowchart nodes and Callouts now support multi-select so you can align, distribute and style multiple items with one click. Easily align Callouts with each other or with Smart Slide elements. Hold Shift to constrain movement horizontally or vertically, Option to duplicate, or both at once to duplicate and constrain nodes while dragging.
Additional Smart Slide Functionality
We've taken this opportunity to pack even more functionality and flexibility into our Smart Slides, including:
- Improved chart editing, including multi-select cells, and autocomplete data series
- New Arrow Bar Slide styles
- Increased Timeline milestone limit
- Webview slide now supports device frames
- Webview includes direct integrations with Figma, Loom, and Typeform
- Org Chart usability improvements, and more control over spacing and color
- Image Carousel now supports a combination of media and text in a flexible grid, with autoplay and looping options
- Organize and manage Classic Slide elements in a layered view
- Additional item scaling options for Icons with Text, Process Diagram and Compare Slices
Improved Media and Text Editing
- Animate images with zoom and slide effects
- Frosted glass backdrop effect for text on images
- Add images or video as slide backgrounds
- Alt text for images
- More flexibility and control over color, including header and emphasized text color
- Add pre-formatted text to a grid cell—like a quote or statistic—in a single click
- Improved clipped text error UI
- Fine-tune color filters on images
You have until March 3 to update at your convenience. After this, you’ll be updated automatically. If you are on a team, your account owner will update your team’s workspace for you.
Get Support
Learn More
Live annotations
Boost your presentation with our new pen tool. Sketch your thoughts on the slides as you go, grabbing your audience's focus and pointing them to your main ideas. Underline key points or show connections while you move through your deck.
How it works:
- Click the pen icon in the player toolbar
- Draw freely—highlight key points as you present
- Marks will fade after a few moments or when you navigate away from the slide
- Click the icon again to turn the pen off

Generate presenter notes with AI
Create presenter notes from your slides using AI, ensuring you're equipped with concise, powerful cues. Transform your slide deck into a compelling narrative with a detailed script, seamlessly crafted to engage your audience.
How it works:
- Open presenter notes in the editor
- Click on the bot icon and select a format for your notes
- Notes will be generated based on the content of your current slide
- View your notes when you present in Presenter View

Transpose table data
Smart Slides make iterating a snap. No more fussing with copy/paste—transpose your Table Slide data in a single click.

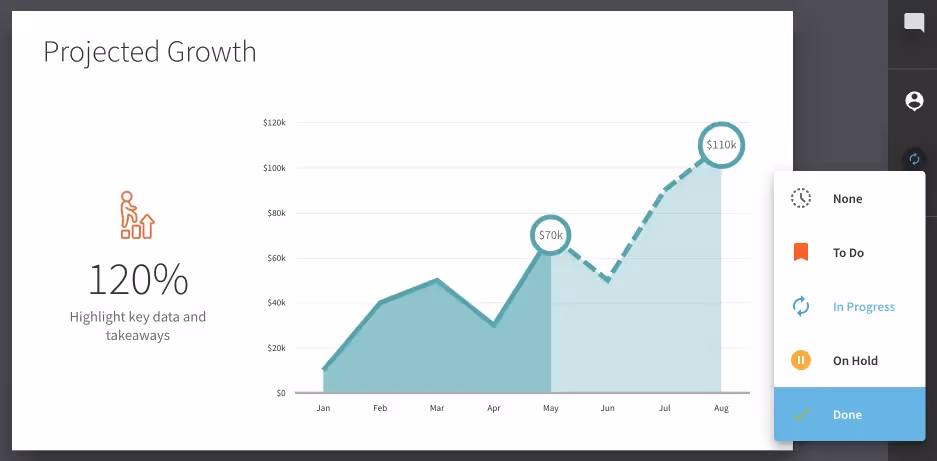
Slide status
Keep your work moving and track progress seamlessly by selecting a slide status: To Do, In Progress, On Hold, or Done.
Stay in sync with your collaborators and receive notifications whenever your slide status changes. Customize your notification settings in the collaboration menu for each presentation.
Effortlessly manage your tasks from To Do to Done.
Gradient backgrounds
Create custom gradients right in Beautiful.ai to use as slide backgrounds.

Here's how:
- Open the Theme Editor and click Add under Background Gradients
- Select your colors and customize styles like angle and noise
- Choose to create multiple backgrounds and select a default background for your slides
- Apply your theme to your presentation. You can find Background Gradients and images in the color panel.
💡 TIP!
Ensure legibility by choosing whether the gradient background is treated as light, dark or color. Smart Slides will automatically adjust text to be light on dark backgrounds, dark on light backgrounds, and will avoid using color on color.
New generative AI features
Go from an idea to a finished deck faster with AI. Simply input a prompt, and our AI will intelligently select words to create a dynamic word cloud. Our Word Cloud Smart Slide layout engine seamlessly integrates these into your deck, ensuring a swift, sleek finish.

Generate a Smart Slide with relevant content from a placeholder in a single click.
Don't let an incomplete idea block your flow. Placeholder slides are the perfect way to pin an idea while you build your story arc. Simply jot down your thoughts and return to them later. With this latest addition to our generative AI toolkit, transforming that note into a beautiful slide is even easier. Click the 'Generate' button below your placeholder slide, and let AI select a Smart Slide and begin populating it with content based on your notes.
AI writing assistant
We've improved and expanded the functionality of our AI text editor to help you get to a more impactful message, faster.
In addition to rewriting your text, you can now generate new text. The AI will use the text on the rest of your slide as added context to give you the most relevant results. Try prompts like "a title for my slide" or a "conclusion with key takeaways".
Easily iterate with the help of AI. Choose from a few suggestions or tweak your prompt and generate new options. Recent rewrite prompts are saved so you can quickly and easily adjust your tone as you work—helping you stay consistently true to your brand voice.
Try it out by clicking the bot icon in the text toolbar on any slide.
Fresh graphics to organize and illustrate your story
Group milestones into time periods, phases of a project or steps in a process. Guide your audience through each stage of your journey—beginning, middle and end.
Our Timeline Smart Slide now includes the option to transform into labeled sections or process arrows.
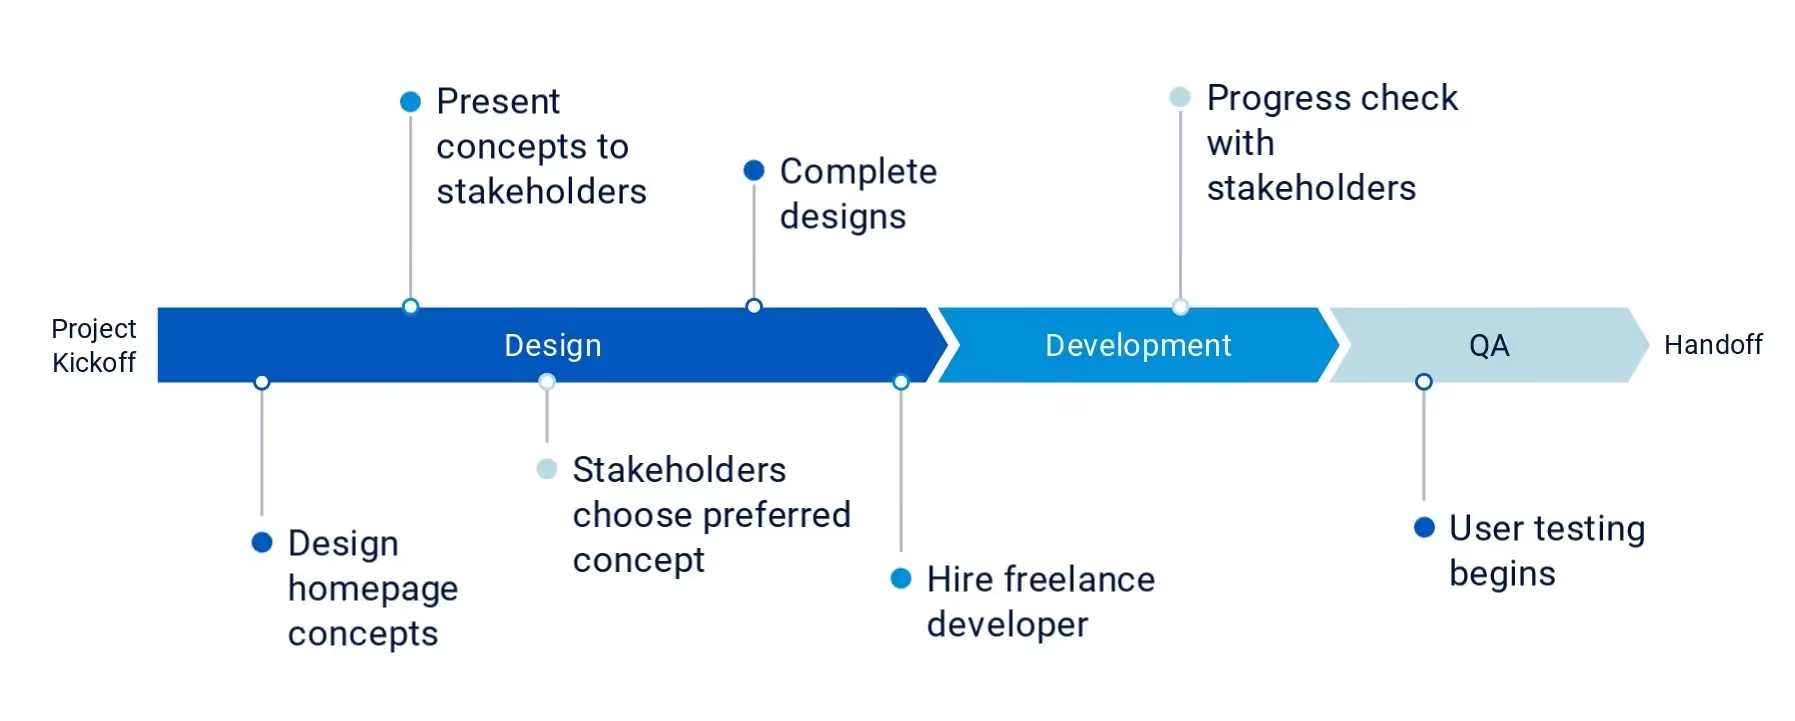
Here's how to add spans to your timeline
- Add a Timeline Smart Slide to your deck
- In the slide control bar, click ADD SPAN
- That's it! Add new spans and customize styles. Click and drag to resize and rearrange.
New Bug Fixes
- Improved selection of chart x-axis titles
- Icons are now consistently sized across table cells
Generate slides with custom context
Context is everything. Now you can add additional context along with your prompt for personalized results—relevant to your story.
Enter a prompt for your slide or presentation, then upload a supporting text document, add a URL, or enter text from any source. Our AI will generate content in response to your prompt, using your added context as source material. If you choose not to add a prompt, we'll create slides based on your uploaded content. The beautiful part? Because they are built on Smart Slides, your generated slides will adapt automatically as you work.
While in beta, Pro users have unlimited access to this feature for free.
Also new!
Dynamic page numbers for our PowerPoint integrations. Export editable slides—or add Beautiful.ai slides directly in PowerPoint using our add-in—and your page numbers will now update automatically as you reorder your slides.
Learn more about our add-in here.

New Smart Slide: Horizontal Bar Chart

Horizontal bar charts are easy to read and allow for longer category labels. Best for times when the order of categories isn't necessarily sequential, like survey results or demographics. As with all of our charts, you can easily import data, adjust settings and even switch between chart types. Use color and highlight points to call attention where it's needed—or add a text tray to your slide to summarize the takeaways for your audience. Your chart will automatically resize to accommodate the additional text.
We've also added the option to adjust bar width and spacing for this and our column chart.
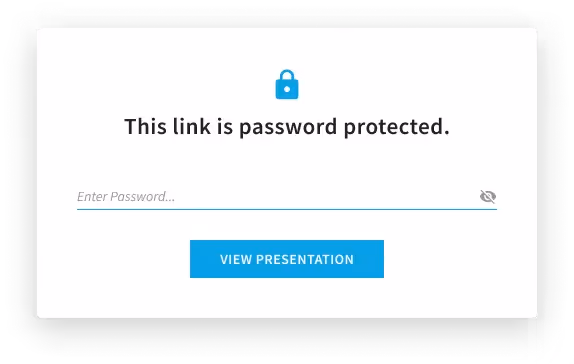
Password Protected Sharing
Choose to add a password to your share link for an added layer of security. Viewers will need the link and password in order to access your content. Name your link and track engagement with Viewer Analytics.
Updated Image Editor
Make an impact with new controls, found in our improved image editor. Just double click your image to bring up the blue control bar, then click the palette icon to open the image editor.
- Remove image backgrounds in just a click
- Adjust opacity—perfect for improving legibility when used as a background for a headline
- Image rotation

New integrations

OneDrive, SmartSheet and AirTable
Joining our growing list of data integrations are OneDrive, SmartSheet and AirTable. Import data directly into your chart or table slide. Teams can keep data perpetually up to date by linking the slide to the source file.

Fresh Device Frames
Choose from an updated selection of devices to frame your product shots. Options now include the latest versions of popular devices, more options in landscape, and unbranded, illustrated versions.
Improved Copy+Paste
Improved copy+paste functionality means you can easily copy content across items, slides and even decks. Stop recreating content. Copy an item—like a timeline marker or image—and paste it into another slide.
Everything your team needs in one place
Give your team the tools it needs to create beautiful decks with consistent branding and up-to-date data.

Team Slide Templates
Create a library of custom slide templates for your team to start from—with structure, design elements, and key content already in place. Built on Smart Slides, your team can easily customize these for their specific use case. Create slides with as little or as much starter content as you like, so your team can simply add a client logo or emphasize a key point for their intended audience and—done!
Team Librarians and Owners can create new Slide Templates from Team Resource management, or directly from a presentation. From a presentation, share a slide from the three dot, more menu.
- Select "Share Slide with Team"
- Make it easy for your team to find by naming it and adding relevant tags
- Choose to share the slide as a finished, uneditable Shared Slide, or as an editable Slide Template
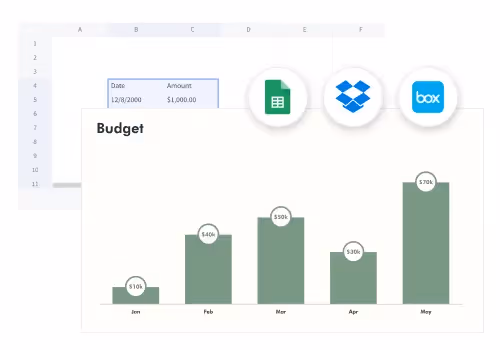
Data Import and Data Linking
Keep your data fresh with data linking. Import data to your chart or table directly from your preferred app and choose to link the slide to the data source. When your source file is updated those changes will automatically be reflected on your linked slide. Import from—or link to—Google Sheets, Dropbox or Box. Additional integrations coming soon!

Media Import
Access your favorite digital asset management app without leaving Beautiful.ai. In addition to Dropbox, Teams can now import from Google Drive, Box and Bynder.
Present with confidence
Keep your viewers focus on your story with streamlined player controls and video narration.

Video Bubbles
With video narration, you can now prerecord your perfect pitch—just hit play! Find this new feature alongside audio recording in the left toolbar of the editor. Add a video bubble, record your presentation and position it on your slide. Send a link to your presentation for your audience to view in their own time, or shake up your presentation with a mix of prerecorded and live narration. A message from the founder? Team updates? Let your audience hear from different voices and subject experts.
Player Controls
When it's time to share your story, don't let player controls get in the way. We've reimagined our player so the options you need are available when you need them, and out of your way when you don't.
It's beautiful what you can do with a little AI
Create the slide you need in seconds with our generative ai. DesignerBot has built custom presentation structures for you, reworked your copy and even created unique images to use. Now you can also ask DesignerBot to generate custom slides, with visuals and content based on your prompting. Because they are built on Smart Slides, they'll automatically adapt to your theme and additional edits—integrating seamlessly with the rest of your deck.

Ready to try it?
- Click Add Slide and navigate to DesignerBot's Slide AI
- Describe the topic of your slide, adding any specific details you want to include.
- Let DesignerBot do the rest!
Find your team resources faster
As your Team libraries grow, it can be increasingly difficult to find the resources you need. That's why we've added the ability to create custom tags for your Team Assets and Presentation Templates. Enable your team to find and add the right headshot or Sales Deck template in a click.
Give your team the tools they need to get better work done, faster. Learn more about our Team Plan

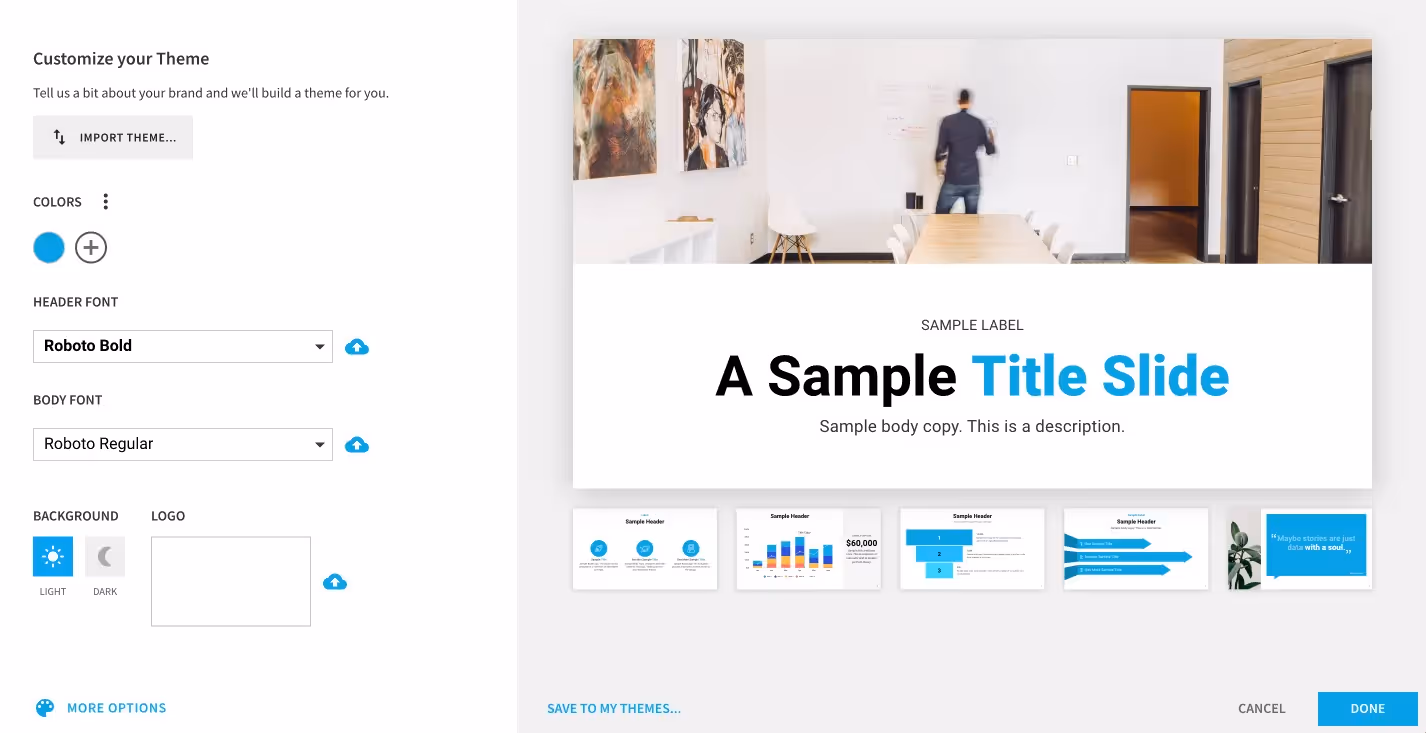
Quick theme builder
Themes define the look of your presentation—ensuring your presentation is visually consistent and on brand. Our simplified Theme Editor means you can create your theme and get started on your content faster. Just add your colors, fonts and logo and get started building your presentation. You will always have access to the full range of options available in the advanced editor to tweak your font sizes, colors and footer. Save your theme to use again later.
To help you get started even faster, PowerPoint users can now import theme essentials from a PPT file. Select your file and we'll create a theme based on the fonts and colors used in your PowerPoint theme. Import your fonts or replace them with our built-in fonts.
A better version history
We've improved our version history experience to make it easier to find the version you are looking for. Just hover to preview the version and click to apply, or choose to copy that version as a new slide. Collapsed groups makes it easier to sort through a longer history and find the right version quickly.
Rich slide notes
Make presenting a little easier. Now standard formatting options like bold, italic and bullets are available in slide notes.
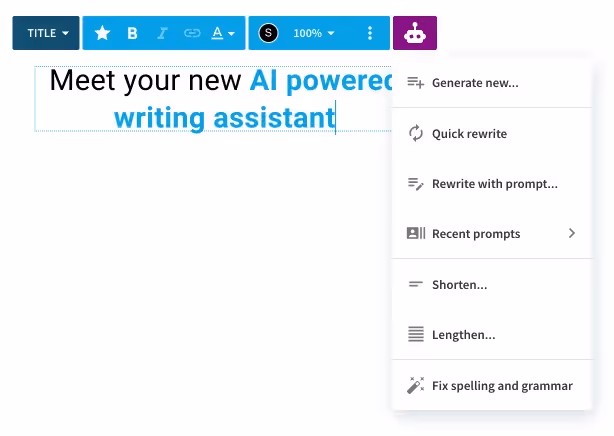
Smarter text editing
Meet your new AI-powered writing assistant
Say goodbye to writer’s block. Let DesignerBot rework your copy and inspire a more impactful message, faster.
- Rewrite. Just select copy and hit rewrite. DesignerBot will craft a new way to phrase your content.
- Make shorter. When presenting, keeping text to a minimum on a given slide is best practice. Easier said than done. Let DesignerBot summarize your text for you.
- Make longer. When you need something more, DesignerBot is here for that too. Speed up your workflow by getting your main point down and let DesignerBot elaborate.
- Change tone. Ensure your content hits the right tone by adjusting it to be friendlier, more assertive or more professional.
- Custom prompt. But really, DesignerBot is here for all your unique needs. Translate text into another language or ask it to generate new content. Try "Summarize the benefits of using AI to generate content" or "Rewrite in the voice of William Shakespeare"

In other DesignerBot news, we've made improvements to our presentation generator. In addition to being faster, you'll get better results, more slides, and more visual variety.
A smarter text editing experience
You'll notice better performance, display quality, and functionality. To benefit from these updates while editing pre-existing slides, just hit Update Slide to get the latest version.
- Select multiple text blocks. Copy/paste and change styling across multiple text blocks, drag to rearrange, and even drag into other items or columns.
- Standardized and more reliable keyboard shortcuts, spellcheck, and support for emojis! 😁
- Improved language support.
- Better quality text display, including more accurate kerning, ligatures and hyphenation.
- Additional block options like equation and code are now available beyond of Classic Slides.
- Improved fidelity and functionality when converting to Classic and exporting, including the ability to select text in an exported PDF.
- More control over bullet point and numbered list styling.
- Lots of pesky text-related bug fixes!

Layouts for right-to-left text
In addition to supporting right-to-left text, we've added the option to create themes that use appropriate layouts. Open your theme editor and turn on RTL text in the typography menu. This feature is currently in beta. We would love to hear what you think and where we can do better. As always, feel free to drop us a note with suggestions and comments in the help center.
Timeline Improvements
Enjoy more flexibility in our Timeline Smart Slide, including control of milestone height and new milestone styles. Choose numbered or bulleted milestones and change icon frame styles. Get the template
Link slides
Storytelling isn't always a straight line. Select any text and in the link menu, choose to add a hyperlink or link to another slide in the deck.
Streamline your workflow
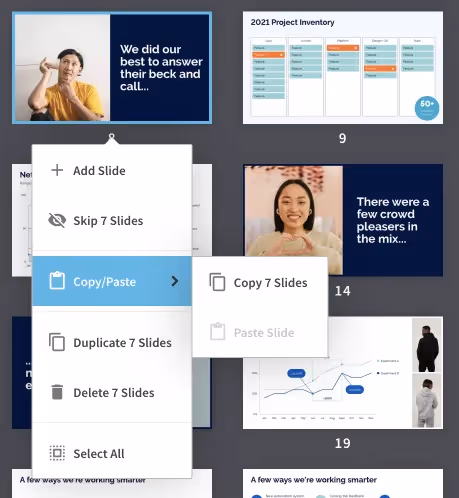
Copy + Paste Slides
We've added new ways to copy and paste slides across decks quickly. Find copy and paste tools in the editor three-dot, more menu—or select multiple slides in Organize view, and use the right click menu or standard keyboard shortcuts.
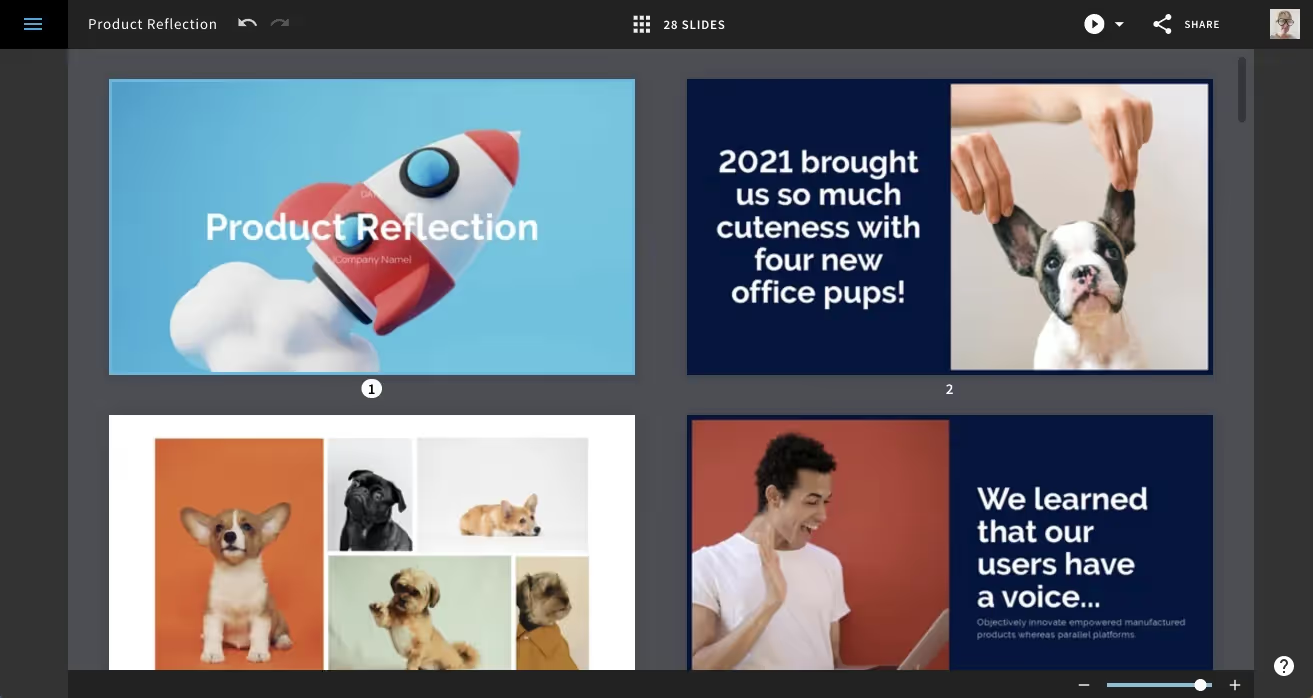
Scale Slides in Organize View
Scale slides up to get a closer look at content, or down to fit more slides in one view.
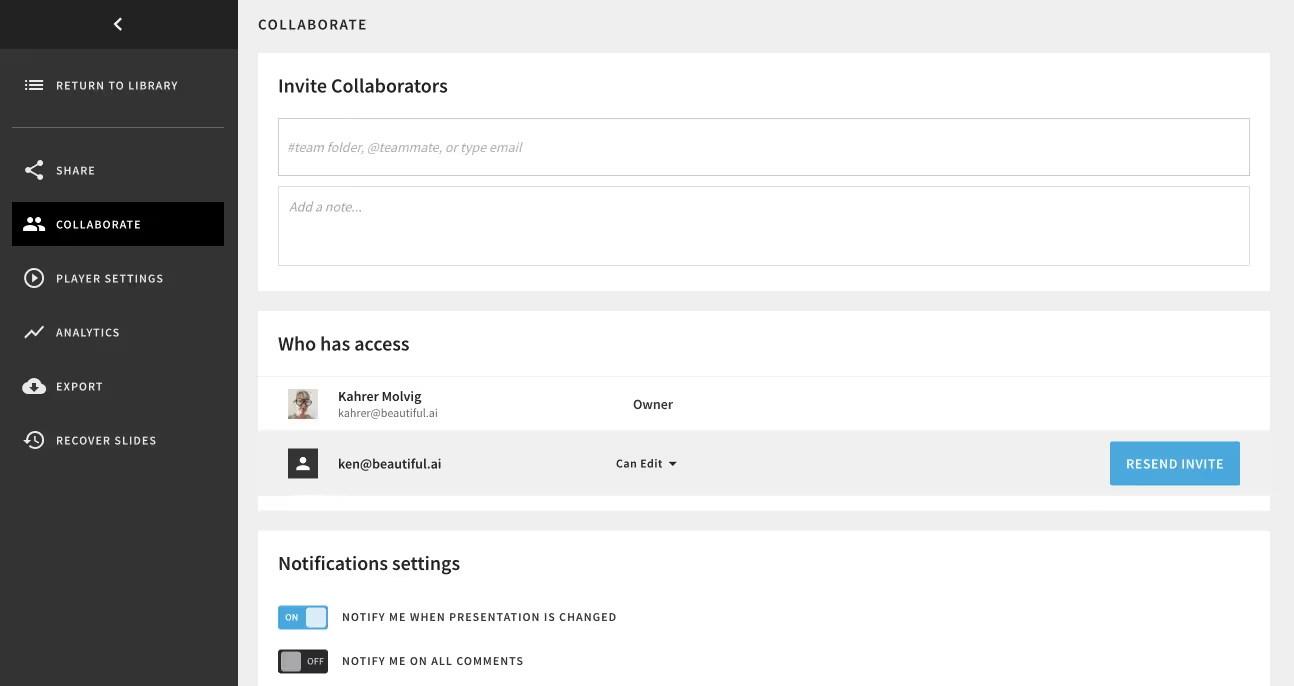
Resend Invitations
Don't let invitations get lost in the email backlog again. Resend collaboration invitations in a click, or copy an invite link to send via Slack or add to a doc. Links will only work for expressly invited collaborators, so your content remains secure. Find this new option in the presentation collaboration menu. For our Teams, we've added this functionality to workspace invitations as well.
Bug fixes:
- Improvements to commenting and assigning slide UI
- Prevent in-app notifications from interrupting slide editing
- Fix to copy+paste line element functionality
Meet DesignerBot
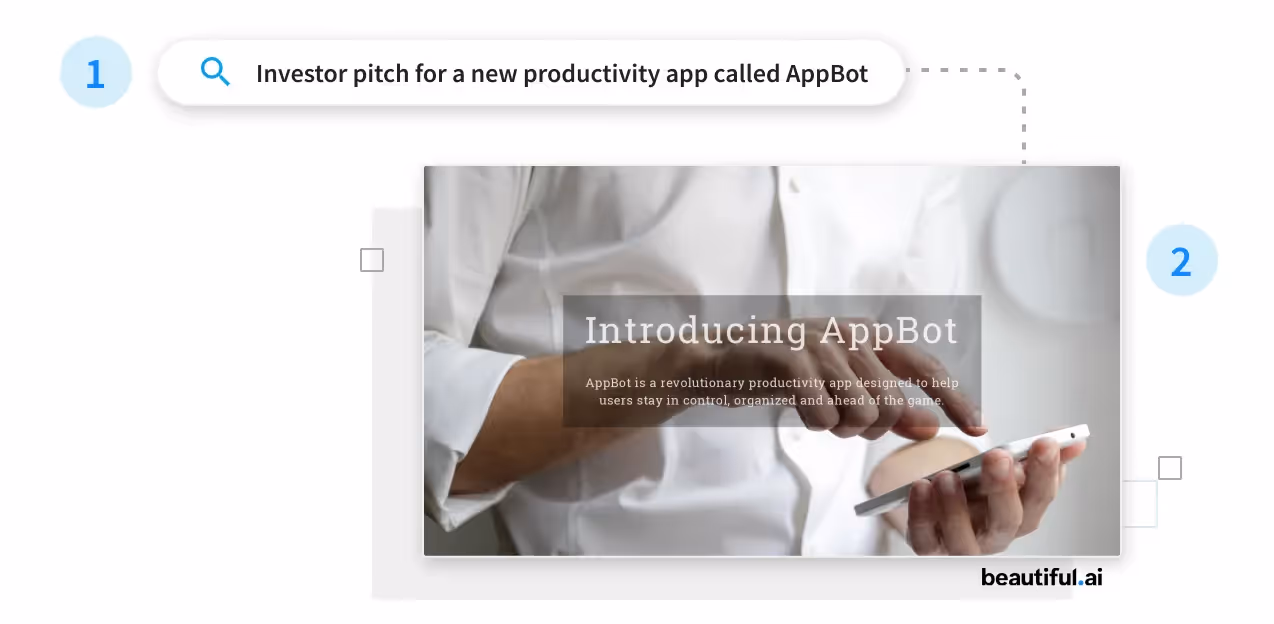
Create unique presentations ✨automagically✨ with DesignerBot (beta)—our built in AI. Describe the presentation you want, and we'll generate a beautiful deck with story, content and visuals already in place.

Ready to try it?
- Click New Presentation and navigate to DesignerBot
- Describe the topic of the presentation, adding any specific details you want to include.
- Let DesignerBot do the rest!
Built on Smart Slides that auto-adapt as you edit, it couldn't be easier to further customize and iterate. Looking for just the right image? DesignerBot has you covered there, too. Enter a prompt and our AI will generate a custom image to visualize your unique story.
Presentations come together in a snap with AI at your side—from start to finish.
Create AI generated images with DesignerBot
Describe what you're looking for, and let DesignerBot create an image unique to your story.

In addition to our image, video and icon libraries, you now have the option to create custom, AI generated images. This is an evolving technology, and while in beta, all of our Pro and Team plans include credits toward images.
Ready to try it?
Be specific and detailed in your prompt—including subject, setting, and mood. Here are a few examples of prompts to spark your imagination:
- Hand drawn sketch of a futuristic flying car
- Photo of busy street in London, people walking to work, morning light
- High quality illustration of a happy robot in space, holding a pencil
🪲 Plus, bug fixes...
Thanks to your feedback, new fixes include adjustments to the export dialogue to accommodate smaller windows.
Even smarter slides
Thanks to your feedback, this month we are releasing improvements to make it easier than ever to tell your story.
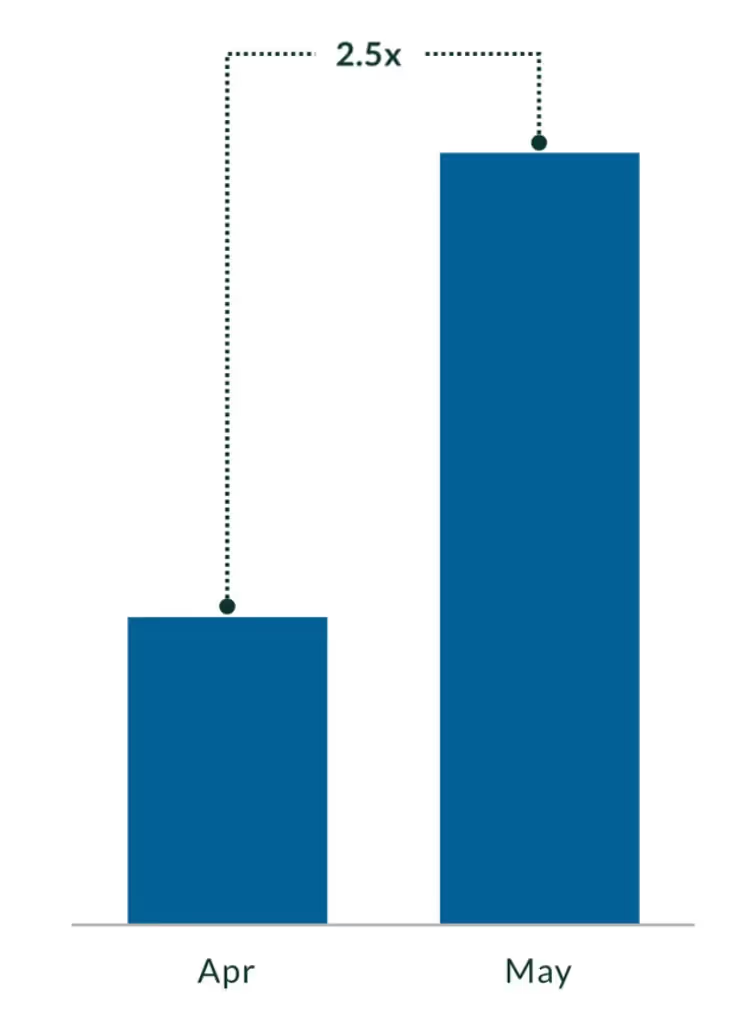
Chart Slides
Let the data tell your story. Show change in value as a multiple with this new formatting option.
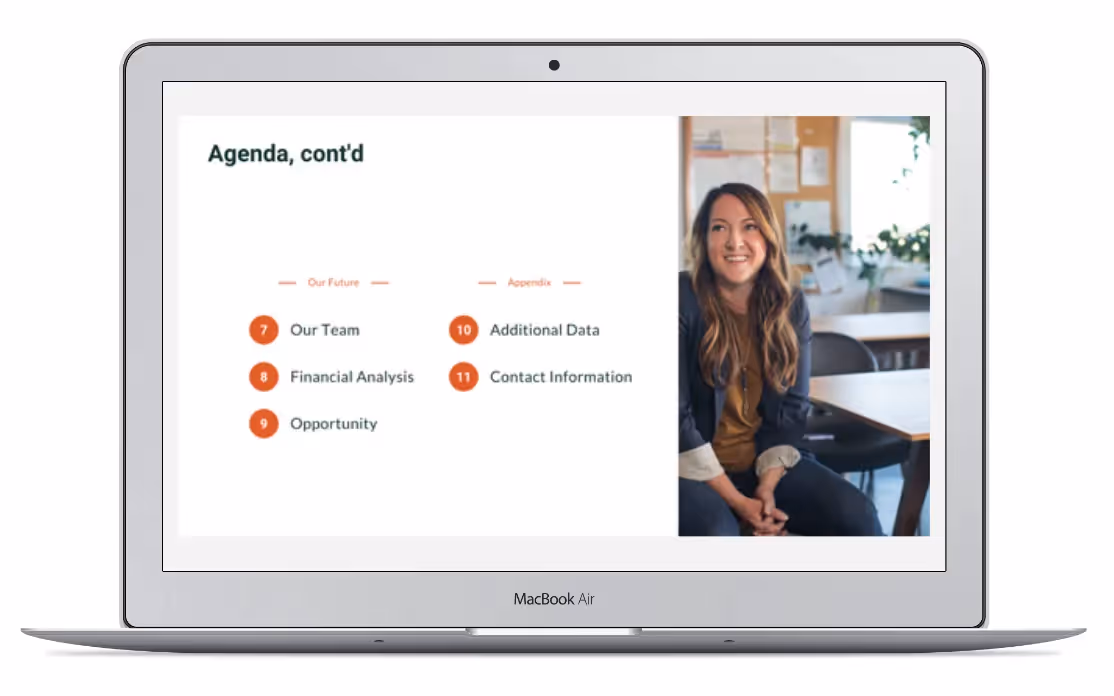
Agenda Slide
Need more items than will comfortably fit on one slide? No problem. Keep multiple Agenda Smart Slides sequential by selecting a start number for each slide.

Convert to Classic
We've made working with slides after converting to Classic even easier. Now most items are converted as groups, so you can rearrange and restyle without fuss.
More Classic Slide improvements:
- Quickly group and ungroup items right from the slide toolbar.
- Select the item you need at a glance with our improved Select Layer dropdown in the right click menu.
- Bug fixes
New to Classic Slides? Learn more
Export to Google Slides
Leverage our Design AI without disrupting your team's workflow. Export Beautiful slides to Google Drive. Choose to export a single slide, or a whole deck, and it'll open—fully editable—in Google Slides.

Brand guardrails

Keep your team consistently on brand by limiting the features members have access to. Customize your Brand Guardrails by role and choose to allow Librarians more creative liberties, while limiting Members to Team Resources.
This is a Team Feature
- Limit access to pre-designed starter materials, including Starter Templates and Inspiration Slides.
- Require your team use Team Themes by restricting the use of built-in and custom themes.
- Ensure the use of approved assets by removing our stock image and video libraries.
- Your team doesn't have to start from scratch (and maybe they shouldn't). Enforce good design practices by removing blank, Classic Slides.
- Decide who on your team can remove design guardrails and convert a Smart Slide to Classic.
Collaborate with confidence
Content Distribution Controls
Keep tabs on proprietary content. Choose to allow your team to collaborate only with other members, and prohibit moving presentations out of the workspace. Team Owners can configure these restrictions in Advanced Team Management, under the profile menu in the top right. This is a Team Feature.
Default Player Settings
Now Teams can configure Player Setting defaults for their workspace. Decide what features are important for your organization, and all new presentations will consistently reflect that. Librarians and Owners can access these settings in Team Resources, along with Player Branding. This is a Team Feature.
Tools to help you and your team stay organized
Import PowerPoint Files
We've made it easier than ever to make the switch to Beautiful.ai. Import existing PowerPoint decks to start from. Make your old decks new with Smart Slides. New to Beautiful.ai? Import a ppt with your branded theme, and save the theme to use next time you create a presentation—with all of your fonts and colors already in place.
Autocomplete Invitations
Invite Teammates to collaborate and add to shared Team Folders faster than ever. TIP! Type # to search folders and @ for teammates
Recently Opened
Stay focused on current projects with our new library view. By default, we'll show you just the last 10 decks you opened to edit.
Nested Team Folders
Organize your content with Team sub-folders.
Copy Share Links
Collaborators with view only access are now able to copy existing share links. Create and name share links for your team and track analytics, all in one place.
Visibly better
This month we're releasing several features giving you better visibility and control over your creation process—from choosing to include skipped slides in your exports to more clarity when choosing a slide.
Updated slide library UI
Beautiful.ai has two types of slides—Smart Slides are templates that intelligently adapt to your content as you work, while Classic Slides are for when you need more control over your design. We've tweaked the UI to help you get a better understanding of the slide you're adding—before you add it.
Improved video thumbnails
Video content is now rendered as a still image in thumbnails and static exports. Clearly see what's what when reordering slides in Organize View.
Duplicate and get to work
Now when you duplicate a presentation, the new presentation opens automatically in the editor. We've eliminated any fumbling for the right copy, so you can get straight to it.
Choose to include skipped slides
Or skip 'em! Decide whether skipped slides are included when exporting your deck to PowerPoint or PDF.
✨ Have you heard? Now you can create Beautiful.ai slides right in PowerPoint with our new PowerPoint add-in! Learn more.
Summer 2022 release: more efficient, intuitive and flexible than ever
From performance improvements to new slide layout and color options—this update is all about enhancing and streamlining the slide creation experience. Read through to get all the juicy details.
But First—New Smart Slides!
In addition to improving our existing library, we've built three new Smart Slide templates.
- Timer: Perfect for shorter periods of time, like a coffee break or breakout session.
- Countdown: For longer periods of time, like days until a product launch or deadline.
- Big Number: Highlight important stats in a flexible grid.

Switch Smart Slides (BETA)
Like slide Variations, you can now switch to any template. Wherever possible we'll preserve your content so there's no need to start again from scratch. We've taken the busywork out of finding the right visualization for your story.
For a Faster Workflow
In addition to performance improvements and bug fixes, we've optimized the UI in key places, so you're done that much faster. Many slides now have the option to jump to the intended number of items in one click. Double-click an image, logo or icon to quickly access its settings and controls, like scaling and filters. We've improved text editing for elements, side text trays and impact slides, like the Headline Slide. This means direct text editing, better scaling and better drag reordering. We've added new styling options here as well, including vertical gap settings and new divider line styles.
More Control Over Color
Change the color of almost anything! This includes text, icons and most shapes. Selecting a new color from the slide color panel will re-set custom shape colors. Shapes will continue to auto-adapt when the background color is changed. You can now define colors for positive and negative values for your theme—perfect for checklists and indicating change in value. New slide header options include background colors and layout. When positioned on the left, you can now drag to scale it up or down. Icons on muted frames will now use that color, instead of black or white. Beautiful!
New Frame Styles
In many cases, you can now change image and icon frames to another shape, fill style or even a device frame, like a phone, laptop or tablet! You'll find these options available in Smart Slides, including Icons with Text, Photos with Text, Carousel, and impact slides like Headline—as well as added text trays and media elements. Now you can show off your new feature—in the right device frame—right along side your growth stats or process diagrams.
Slide Background Images
Upload slide background images to your theme. Choose whether it is treated as light or dark to ensure legibility, and opt to select one as a default background.

Smart Slide Improvements
We've gone through our 60+ Smart Slides and added even more layout options, variations and improved design.
Venn Diagram
- Preserves relative spacing of bubbles when scaled—when you resize your header, for example.
- Labels now have descriptions, can be manually positioned and resized horizontally. Auto Position will intelligently position your labels again.
- Bubbles can be reordered (bring to front, send to back). This is great for selecting smaller bubbles within larger ones.
Pyramid and Funnel
- New styles! Represent your marketing funnel graphically by numbering or adding icons (or images) to your sections.
- Improved text scaling.
Target
- Position your target on the left, center or right, leaving more space for call out text.
- Switch labels to callouts and back again without losing data.
Bullet List
- Drag to arrange items in multiple columns, and add column headers (think pros and cons!)
- New checklist style! Click to change check icons to a muted style or an X.
Carousel
- View, reorder and delete carousel items in a single view, with the new management menu.
- Resize, reposition and add frames to images per item—yes, device frames too!
- Customize transition effects for carousel playback.
XY plot
- Control layering of items (bring to front, send to back).
- Simplified items for simpler editing.
- Copy/paste items.
Hub and spoke
- New, simplified item elements.
- Choose to position the hub at the top, with the spokes radiating down, or at the bottom.
Org chart
- Color code your org chart per item.
% icons
- Added flexibility to show more stats on a single slide.
- Improved behavior when using numbered stats instead of percentages, so you can manually set the icon fill independent of the number input.
- Option to fix the number of icons shown in each stat so that all of the items on your slide look consistent.
Charts
- Improved performance when dragging change in value annotation.
- Change in value annotation now includes CAGR formatting, a Growth/Trend Line style option.
- Choose to position chart titles above or below.
Classic Slides
While we are passionate about the automated design that our Smart Slides offer, we know sometimes you just need to start from scratch with a blank slide. We haven't overlooked our Classic Slide here.
- Frame style options are now consistent across Smart Slides and Classic, helping to create a more cohesive look throughout your deck, and improve fidelity and usability when converting to Classic.
- Additional shortcuts and right click menu options to speed your creation process, including Select Layer, and Cmd-D to copy and repeat your last transform.
- Improved grouping, locking and selection behavior.
- Prevent default browser behavior on keyboard shortcuts like command-g.
As you can see, we've been busy! Give these new features a try, and as always, let us know what you think. We love hearing from you and take your feedback to heart.
Centralize your assets, and close the loop with your audience
Viewer Comments
Enable your audience to interact with your presentation. Now when you share a link to a presentation, you can decide to allow viewers to comment on it. Presentation editors can view and respond to all comments—both Internal and Viewer—right from the presentation editor.
Centralized Team Assets
Beautiful.ai's new Team Asset Library makes brand-compliant decisions the default for all employees building presentations. Librarians can upload pre-approved brand assets to a centralized library for Members to grab from as they’re building slides.
The Asset Library also enables Librarians to maintain presentation media with 100% precision. Modified screenshot? New headshot? No problem. When an asset is replaced in the Team's library, it updates automatically in every presentation where it’s used.
This is a Team feature.
Create a branded viewer experience
Upload your logo or branded animation to customize your team's presentation loading screen. Go beyond branded themes, and ensure your viewers' experience is true to your brand from the very first impression.
This is a Team feature.

Multiple team themes
Now save all of your go-to themes under one account. Whether you're working with multiple brands, serving many clients, or simply using different designs for internal and external presentations, you can now make these shared themes available to your entire Team.
The Webview Slide
Demo your product, show off your website, or display a live poll! The new Webview Smart Slide allows you to embed webpages on your slides.
Better ways to share
PDF Download
Perfect for static copies or offline review, now you can give your viewers the option to download a PDF of your presentation from the player.
Require email to view
Get more granular with analytics by requiring viewers to provide their email before viewing your presentation.
Expiring links
Create time-bound access to presentations by configuring expiration dates for your shareable links.
New icons
From TikTok to data lakes, we added 180 new icons to use in your presentations.
Other improvements
- Faster loading – Say goodbye to sluggish libraries. Power users will notice significant gains in loading times.
- Slide conversion highlights – You converted your slide to Classic and want to switch back? This new highlight point in slide history makes it easy to find the version you need.
Beautiful.ai for monday.com
Whether you’re managing leads, campaigns, employees, or tasks in monday.com, the Beautiful.ai app enables you and your Team to quickly reference the most up-to-date versions of corresponding pitches, project plans, and strategy decks — directly within your monday.com boards.
Embedding Beautiful.ai presentations keeps everyone on the same page by giving monday.com teams direct access to the most up-to-date version of presentations. Install the app now to add presentations to your projects!
Set your slides in motion
Animations timeline
A new non-linear animations editor gives you granular control of when your slide elements appear during playback. You can now create dramatic animation effects by "growing" elements, customizing animation order, and creating suspenseful delays between elements. Read how.
Stock video library
Choose from over 80K videos to liven up your slides. Stock videos can be added as the background on headline slides – or anywhere else you use icons and images! With content ranging from reverse to fast-forward to slow-motion to time-lapse, you can quickly find the perfect visual effect for your slides – without leaving the editor. Read how.
Other improvements
- Classic Slide animations - Classic Slides now support animations and videos!
- Chart data import design - We've updated the data import experience to be more flexible and intuitive.
- Logo file visibility - No more white-on-white! Light logos now display on a dark background, and original logo file names can be accessed on hover.
- Mobile playback - We know you're on the go. Rotate easily between landscape and portrait on mobile, uninterrupted.
Start your story off right
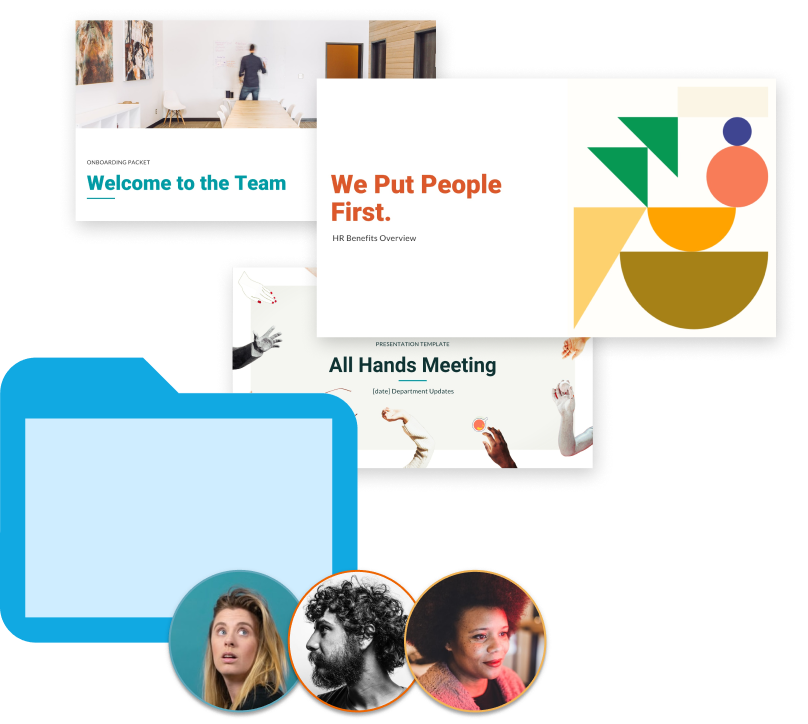
Team Templates
Team Owners and Librarians can now build presentation templates for members to start from.
Team Templates are plug-and-play starter decks that help members kick off their presentations and maintain critical storylines. With presentation structure, design elements, and key slides already in place, members can quickly replace content to customize their story without getting bogged down with the details.
Quickly convert existing presentations into Team Templates, or build new templates from scratch. Learn how.
Team Folders
Now, all members can create Team Folders to organize shared content. Whether they're collaborating on a project or working with their department, members will be able to seamlessly create and configure folders that allow them to share with the right people at the right time.
Team Owners can view and manages all folders from the Team Resources center. Learn more.
Find exactly what you need
Deep text search
As your presentations scale, it can be a pain to hunt down old content. Now you can locate the presentation or slide you're looking for with just a few key words. Our new, comprehensive slide search searches across all of the text in your account to show you the most relevant results.
Go ahead and try it out from your presentation library or by adding a new slide.
Chart improvements
We did a deep dive on chart templates and made a whole slew of improvements we know you'll love! You can look forward to an optimized data import, as well as a ton of new functionality like:
- Additional layout options for multi-chart slides
- Option to annotate absolute or percentage changes between points
- Smart date formatting for category labels
- Improved data highlight styling
- Customizable line weight for line, area, and spline charts
Stop, collaborate, and @mention
This release includes new collaboration features and a help center revamp to help you get more done, faster:
- @mention your teammates in comments
- Assign collaborators to the slides they’re responsible for creating or presenting
- ⌘? Reference copy, paste, undo, and other advanced keyboard shortcuts in the editor
- Access FAQs and step-by-step tutorials from the help icon
Design without limits
The last 5%
We hear you: Sometimes Smart Slides are exactly what you need, and sometimes they only get you 95% of the way there. Starting today, you can make those final tweaks to Smart Slides by choosing to break the design ai and convert them into Classic Slides.
Classic Slides give you unlimited flexibility to design your slides as you see fit with a more familiar authoring canvas. On Classic Slides, you have access to:
- Text: Use any font you’d like, or stick with the fonts in your theme. Multi-block text styling and widgets for displaying code and equations level-up traditional text editing.
- Color: Customize text, fill, and lines with any color you’d like, or choose a color in your theme.
- Smart components: Leverage powerful charts and tables in your Classic Slides.
- Positioning: Position elements wherever you’d like with the help of alignment guides. Use grouping and layering tools to get the perfect look.
- Shapes and media: Draw paths, add shapes, and dress up your assets with our library of device frames for images.
So go ahead: add that last item, adjust your margins, and make those icons just slightly smaller. Convert to a Classic Slide when you really need it – or use a Classic Slide to start from scratch – and let Smart Slides handle the rest.
Read more from our CEO about our decision to develop Classic Slides.
_final_final_new.pptx
We know how much time you invested in those decks – don't lose your old work. Import your existing slides into Beautiful.ai, and incorporate them into your new presentations.
Our presentation importer prioritizes precision, maintaining every possible visual detail we can from your original slides. Your imported slides will be fully editable and inherit from your presentation's theme wherever possible, so even those old slides will blend in with your new look. Any .pptx file will work, so you can renovate Keynotes and Google Slides while you're at it.
Learn more about importing your presentations.
A new journey for you
✨ The Journey template
Sometimes our paths aren't linear. Ups, downs, highs, lows – a straight, flat timeline or list of bullet points doesn't communicate those nuances. We created a winding twist on the classic Timeline to give you more options for communicating the sequence of events over an abstract period. Journey has plenty of fun surprises in store:
- Customize your milestones - Choose to use icons, images, map pins, or dots to mark your Journey milestones
- Configure start and end markers - Give your Journey definitive start and end points with descriptors, or let it flow off the canvas
- Emphasize certain milestones - Override the automatic milestone color with another color from your theme
- Try a variation - Seamlessly switch between Timeline and Journey to see what communicates your content best
Add a Journey slide to your next presentation, and let us know what you think!
Mobile updates
Look at you, always on the go! We realized our mobile experience wasn't quite up to par for those of you who regularly look at content from your mobile devices. We've released a few updates that should make your mobile experience more useful and less buggy:
- Share across all your apps - Share a link to your presentation using your device's mobile sharing mechanisms
- Collaborate, right from your phone - Add collaborators to your presentation without having to fire up the desktop app
- Rotate away - We addressed some bugs with mobile playback that made it a pain to rotate between portrait and landscape
Putting it all on the table
Table template improvements
We heard your feedback: Sometimes our table template could be frustrating to deal with. That's why we completely overhauled the table to turn it into a template you'll want to come back to over and over. Updates include:
- Better autofit, styling, and sizing. Autofit your rows or columns. Bulk select and edit multiple cells at once. Control your text size down to the pixel.
- Merge cells.
- Better copy/paste. A blank cell is not a zero. Now the table template understands that. Copy and paste from your source data with much higher accuracy and ease.
- Custom colors and decoration. Use visual cues in your tables by adding flags to your cells and customizing fill, icon, and text colors.
- Much faster performance. Now you can make Really Big Tables! We've made it a lot faster to input data into your tables and add columns and rows, which should make working with tables much more seamless, all around.
Try it for yourself by adding a table slide to your Beautiful.ai presentation!
Invite friends, earn credit
Beautiful.ai Referral Program
We're excited to announce our referral program! You can now refer friends for future credit on your Beautiful.ai subscription.
Just navigate to your profile, click Referrals, choose how to share, and watch your credit stack up. Sharing with friends is a beautiful thing, isn't it?
✨ New year, new look
Create stunning slides with less effort
- Inspiration gallery - Choose from hundreds of beautiful, pre-built slides to add to your presentation. Since these slides were created with our smart templates, you can easily customize them with your own content. Click "Add slide" > "Get Inspiration" to peruse the gallery.
- Refreshed themes - We've added 10 beautiful, new themes to choose from when creating a presentation. You can rely on any of these built-in themes to create a clean, professional presentation. To see all your options, create a new presentation now.
- Presentation templates - Start your presentation from one of more than 50 pre-built templates. Let these templates serve as a guide for your story, and tweak them as needed!
- Chart and accent colors - You can now define dedicated colors for charts and accents. These theme customizations increase legibility and add sophistication to your presentation. Edit your theme to define these colors.
Experience faster, more intuitive editing
- Performance improvements - We heard your feedback around laggy typing and jumbled text, so we decided to make a change. With a 50x improvement in performance in this update, your text woes are a thing of the past.
- Editor layout - We reorganized controls in the presentation editor to make the experience simpler and IA more intuitive. Slide-level controls, like Elements and Layout can be found on the left, presentation-level controls at the top of the screen, and collaboration features on the right sidebar.
- More intuitive controls - Copy and paste elements from slide to slide. Drag and drop your text anywhere on top of an image slide. Select whether to add a numbered or bulleted sublist. You'll discover all of these simplifications and more while editing your slides.
Scale your presentation library with ease
- List view - It's finally here! You can now choose to view your presentations as tiles or a list. Sort by presentation owner, created date, and more to manage your ever-growing library of content.
- Simple sharing - 1-2-done! Invite people to edit or view your presentation directly from the presentation dashboard or the presentation editor. Sharing en masse has never been easier.
More control for teams + comments for everyone
Team updates
- Update your invoicing email - Send your invoices directly to finance@, receipts@ - whomever! - without having to add them as a member. Team owners can update this information from the billing pane.
- Choose how to handle presentation ownership - When removing a member, team owners can now choose to transfer the affected member's presentations to someone else on the team in order to retain important company collateral.
- Navigate to your team workspace faster - Your team workspace is now prioritized as your default workspace when logging in. To increase accessibility, team workspaces will also show up at the top of your workspace dropdown.
General
- Comments are now available to everyone! Now when you invite your client or colleague to collaborate on a presentation, they'll be able to see your feedback without needing to upgrade.
Beautiful.ai for teams
Finally, an effortless way to keep everybody on-brand and every slide up-to-date: the Beautiful.ai Team Plan is here!
Check out some of the ways we're making it easier to manage your team's presentations:
- Shared Slides: Design a slide once, and allow your team to use it infinitely. Push updates to all presentations in a single click. Learn more.
- Shared Theme: Lock in the right logo and brand elements for use across your team, staying visually consistent from pitch to pitch. Learn more.
- Team Administration: Manage user roles and permissions, centralize billing, and structure your team for simple sharing and collaboration.
Sign up for a 14-day free trial now!
Get presentation updates in Slack
Beautiful.ai Bot helps you collaborate on presentations by sending you realtime updates about your presentations directly in Slack! Just add the app to Slack to get started.
When you add the app to Slack, we'll send you updates each time a collaborator makes any of these changes:
• Adds a comment
• Edits a slide
• Adds a slide
• Moves a slide
• Removes a slide
• Renames the presentation
• Changes the presentation theme
Go ahead and try it out! All you need to do is authorize the app, create a presentation, invite a team member to collaborate, and watch the magic happen as they edit the slides!
Use Beautiful alongside Dropbox and Google Drive
Access your presentations from Google Drive
Now you can organize your Beautiful presentations right alongside all of your other content in Google Drive. This is just one of the many steps we're taking to make collaborating with your team even simpler. Read more about how to connect your Google Drive account here.
Import media from Dropbox
We've made it easier than ever to grab the media you need for your slide directly from your Dropbox account. When adding an image to your slide, just choose Dropbox as the source, and voila! You can peruse your Dropbox folders and integrate that content directly into your Beautiful presentation - all without leaving the app. Read more here.
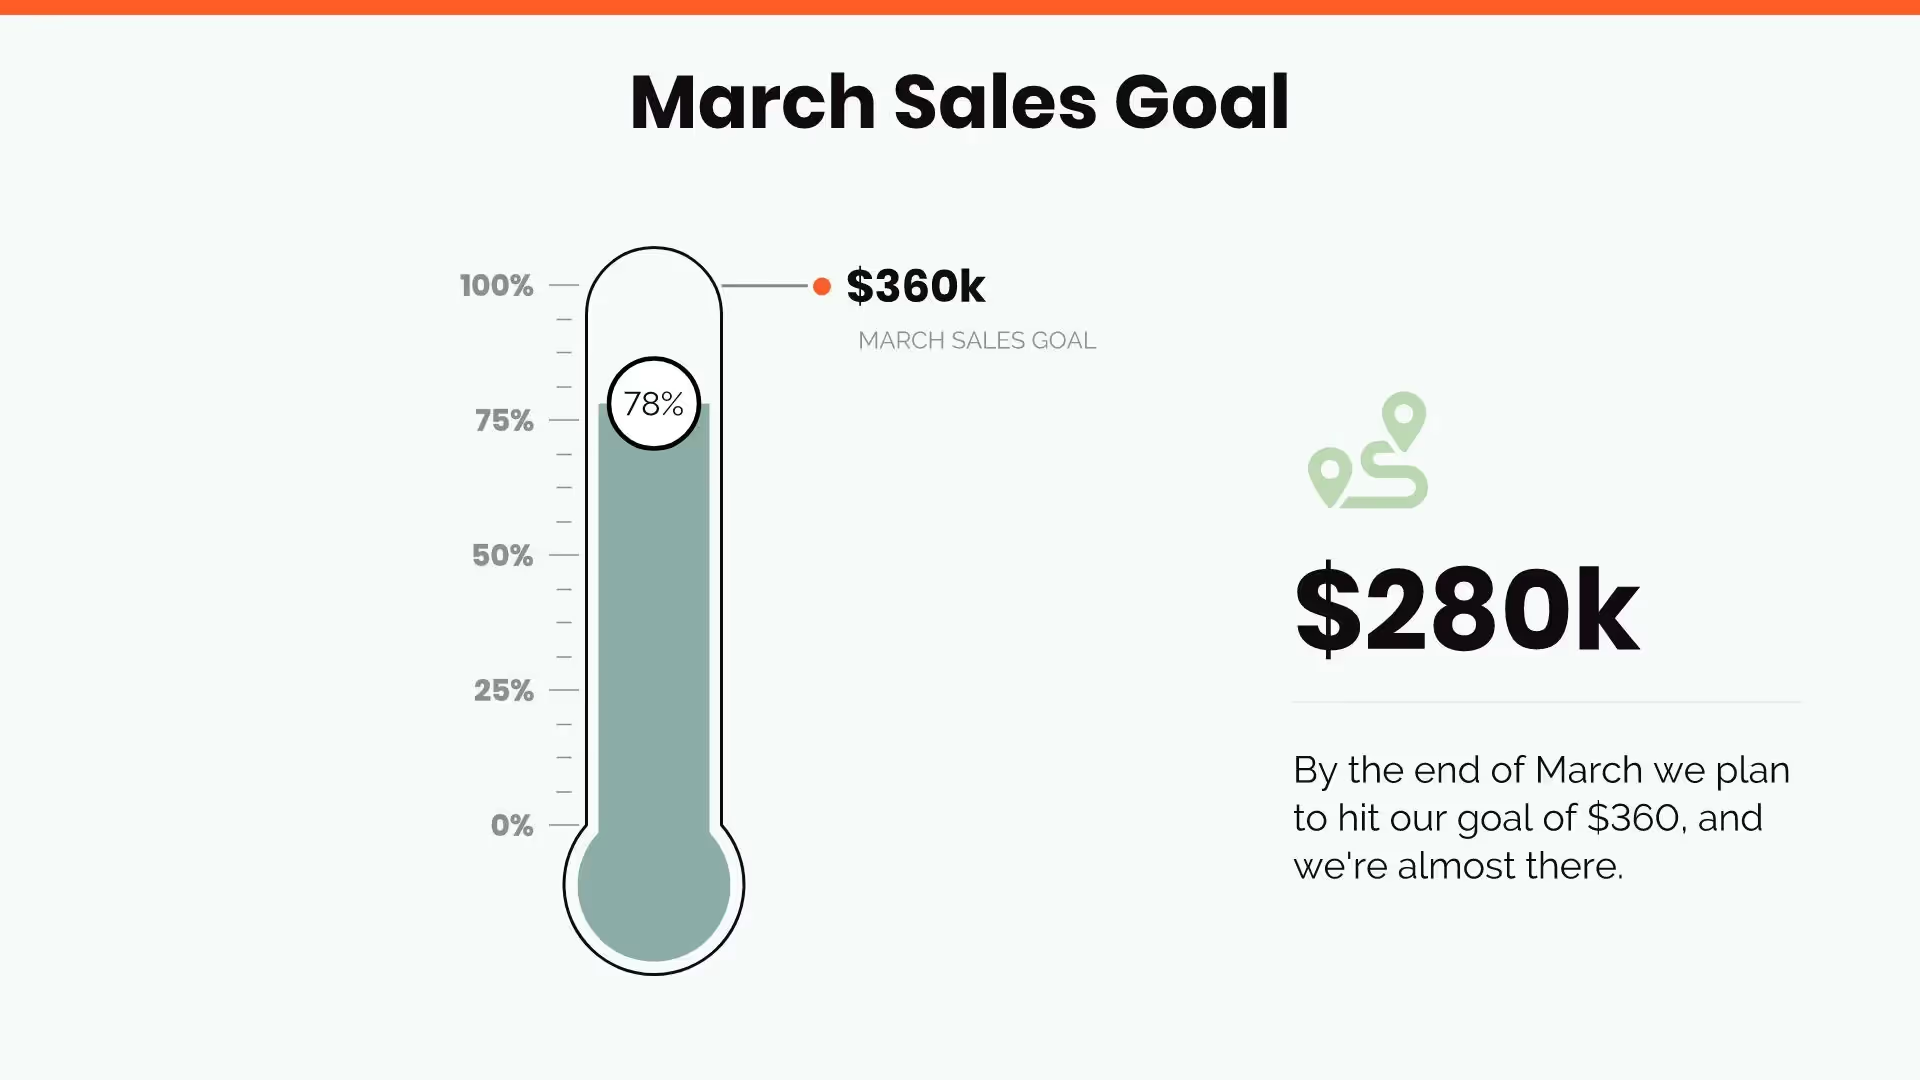
The heat is on
Our brand new thermometer Smart Slide has been released into the wild! Use it to track and report on progress toward a goal. Intuitive controls allow you to easily adjust the fill of the thermometer, customize the reporting units, and add informational callouts.
Never miss a beat
We're bringing you new ways to collaborate and stay up to date on presentations through our new comments and notifications features.
Using comments, you can have a dialogue about the content and storyline of your presentation without leaving the app. Comments allows you to leave messages on slides for your teammates (or yourself!). Learn more here.
You and your teammates will also be notified when a comment is added to a slide or when the slide is changed. Edit your notifications settings to customize how you're alerted - in-app or via email - to make sure you're up to date on all of your presentations. Learn more here.
More options for video and audio
Forget the days of recording and re-recording audio tracks and meticulously organizing all of your mp4 files to upload to your slides. We built an audio recorder directly into the app, so you can narrate your story faster and easier. Learn more here.
And while YouTube and Vimeo have some really great content, we know that you do, too. Now you can upload videos to your slides directly from your computer. Learn more here.
More flexibility, same great design
Our new Elements feature allows you to venture outside the constraints of our Smart Slides to emphasize your points. Now, you can add shapes, text, images, icons, and lines to your slides with elements. Elements are built with the same design intelligence and automated components as our Smart Slides, so you continue to have the help of a designer as you leverage elements to customize your message.
Remember: With great power comes great responsibility. Use elements with discretion to keep your presentations clean, simple, and effective!
