In many presentations, you may need to display an overview of tasks within a project. A visual graphic like a Gantt chart offers a much more effective and clear way to do so than sharing a long, text-heavy list of tasks. Wondering how you can use a Gantt chart for your company? Below, we talk about these charts’ features, benefits, and how to build your own using our Gantt chart template.
What is a Gantt chart?
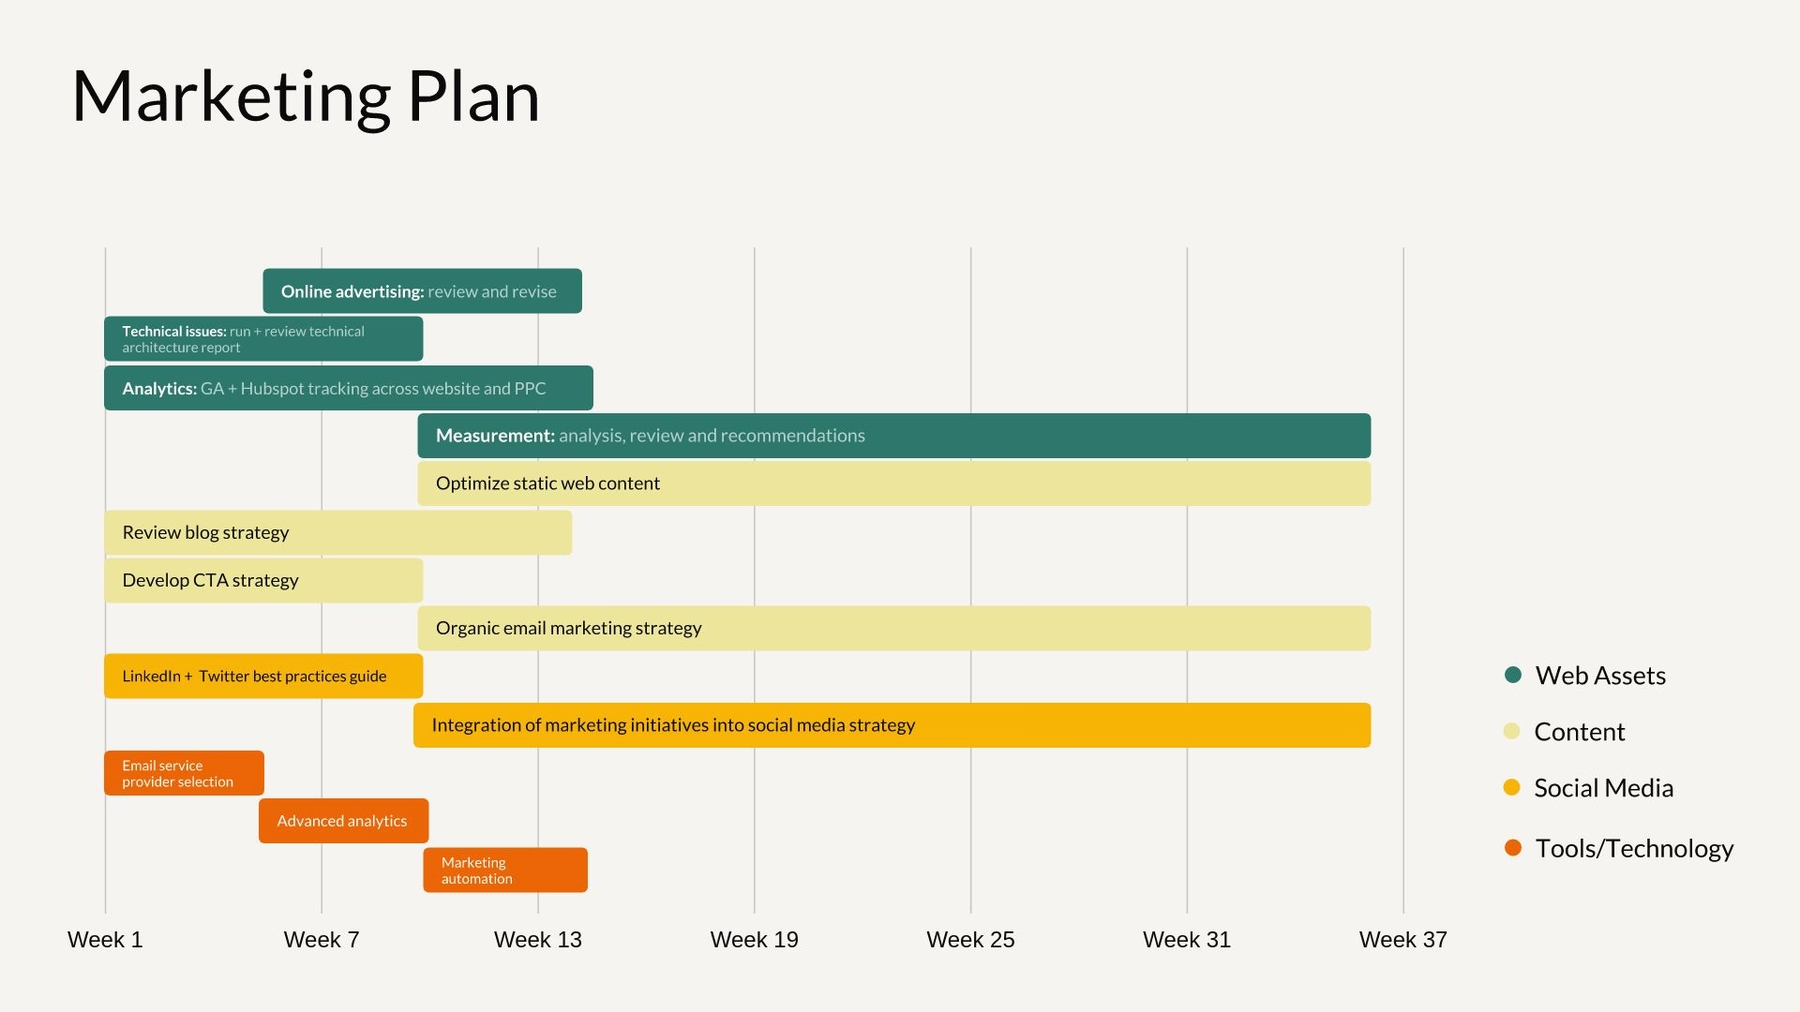
A Gantt chart, named after its early 20th century inventor Henry Gantt, is a birds-eye view of a project. It visually organizes tasks displayed over time. Gantt charts are incredibly useful tools that work for projects and groups of all sizes.
The left side of a Gantt chart lists each task in a project by name. Running along the top of the chart from left to right is a timeline. Depending on the demands and details of your project, the timeline may be broken down by quarter, month, week, or even day.
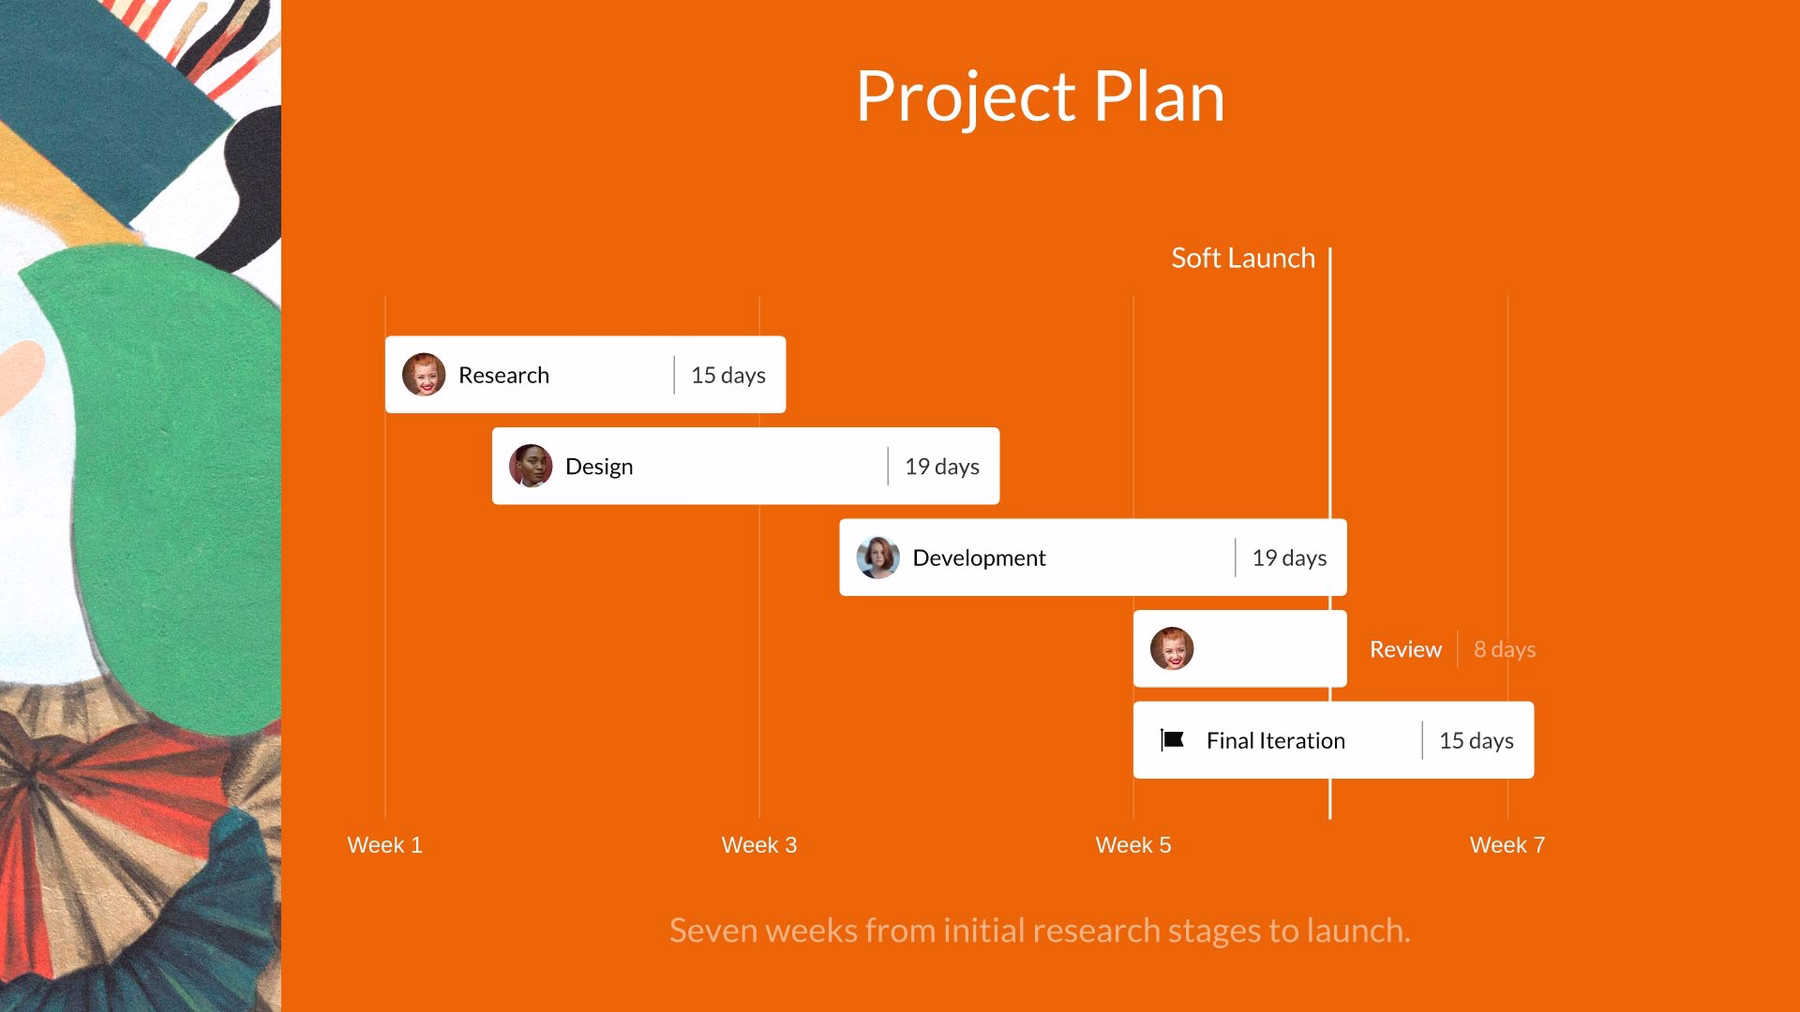
Each task is represented by a bar, whose position and length represents its start date, duration, and end date. You might also see who is assigned to that task by labeling the bar. With every task represented by a bar, you can see at a glance:
- How tasks will overlap
- How long each task will take
- How different departments or groups work together
- When each task begins and ends
- When the overall project begins and finishes
Gantt charts create clear project schedules that everyone in an organization can use to stay on track. But that’s not all companies use these charts for.
The benefits of using Gantt charts
Gantt charts do more than keep team members and managers organized. Gantt charts can also display your project’s progress and create small wins for your team. In the words of monday.com Senior Project Manager Dotan Egozi, “Gantt charts are perfect for breaking down big projects and celebrating small wins, which is the key for a successful project.” Looking at a large project with one big end goal can be overwhelming. With a Gantt chart, you can set smaller milestones within your project; fixed dates that signal the end of a phase or the completion of an important task. Milestones break up your project into more manageable chunks that will motivate your team to keep moving toward the next milestone.
Because of the structure of a Gantt chart, you can easily see how tasks depend on one another, who is responsible for which task, and how tasks across teams or divisions relate to each other. This level of detail makes roles and responsibilities clear, ensuring that everything gets done and team members aren’t left wondering what they need to do. That leads to better productivity and team organization overall.
Don’t get stuck thinking that Gantt charts are used strictly in project management, either. If you need a resource to keep on hand that explains how a company process works, a Gantt chart can break that process structure down in an easily understandable format. Need to build out a tentative timeline or roadmap for a future project? A Gantt chart can get you started.
Tips for creating your Gantt chart with our template
Building an effective Gantt chart takes a little elbow grease, but it’s worth preventing confusion and disrupted workflow in the future. Here are some pro tips to help you create your own using our Gantt chart template.
Use different colors
How many colors you use and how you assign them is up to you. You might choose one color to represent a specific team or department so that you can see who is responsible for which tasks on your chart. Or you might use one color to represent a certain group of tasks within the project, making it clear how tasks are progressing and which phases are near completion.
Set milestones
Don’t forget to set milestones where they make sense: deadlines required by clients or customers, when a new department takes over the next phase of the project, or when a long list of tasks is completed.
Label your tasks
When used with a deliberate color scheme, labeling your tasks with its project owner will prevent confusion and make roles clear to everyone. Be sure to assign each bar on your Gantt chart to the appropriate person. This can also help ensure the workload is balanced.
Level up your presentation with our Gantt chart template
Ready to get started with your own Gantt chart to organize workflows and tasks? You’re in luck: our Smart Slides library now includes a Gantt chart template. This template lets you customize your presentation even further, with better flexibility and creative control. Get started with your Gantt chart today, and take advantage of the easy customization and quick setup that Beautiful.ai offers.
To take advantage of all the Smart Slides in our library — and to customize them easier than ever before with our latest Elements update — become a Beautiful.ai member today!