{{template-name}} Template
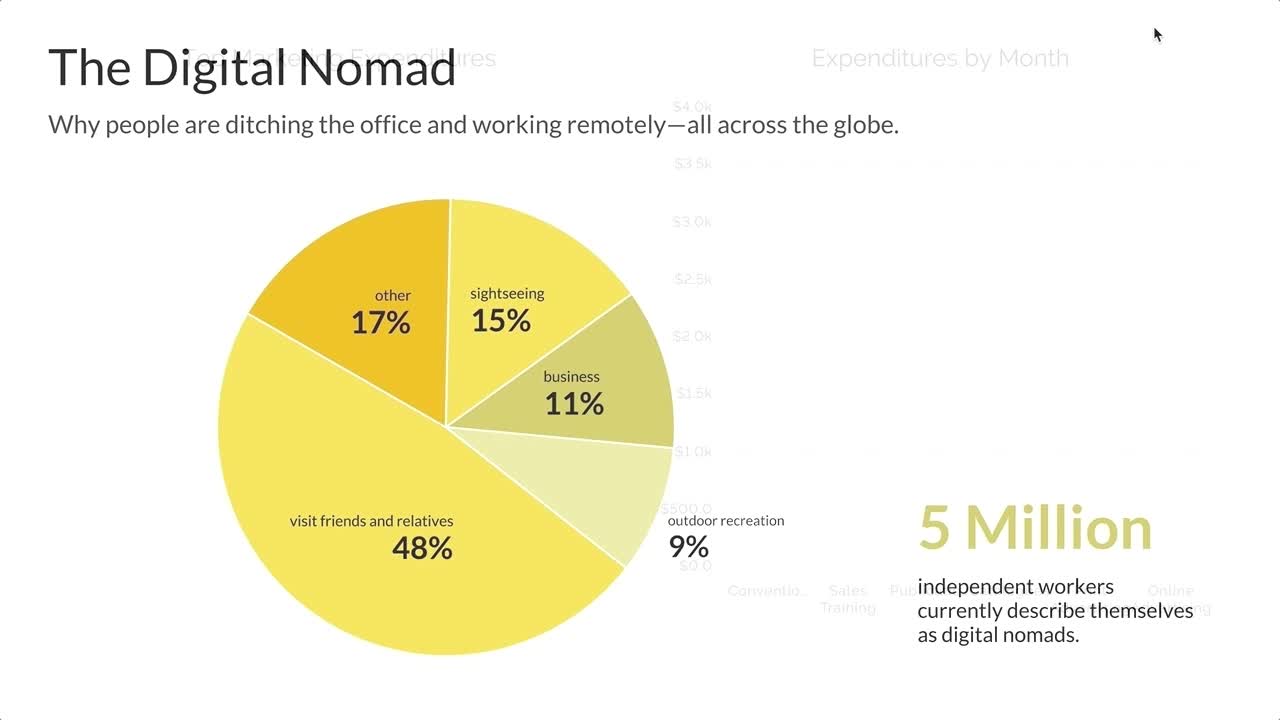
{{template-name}} template styles
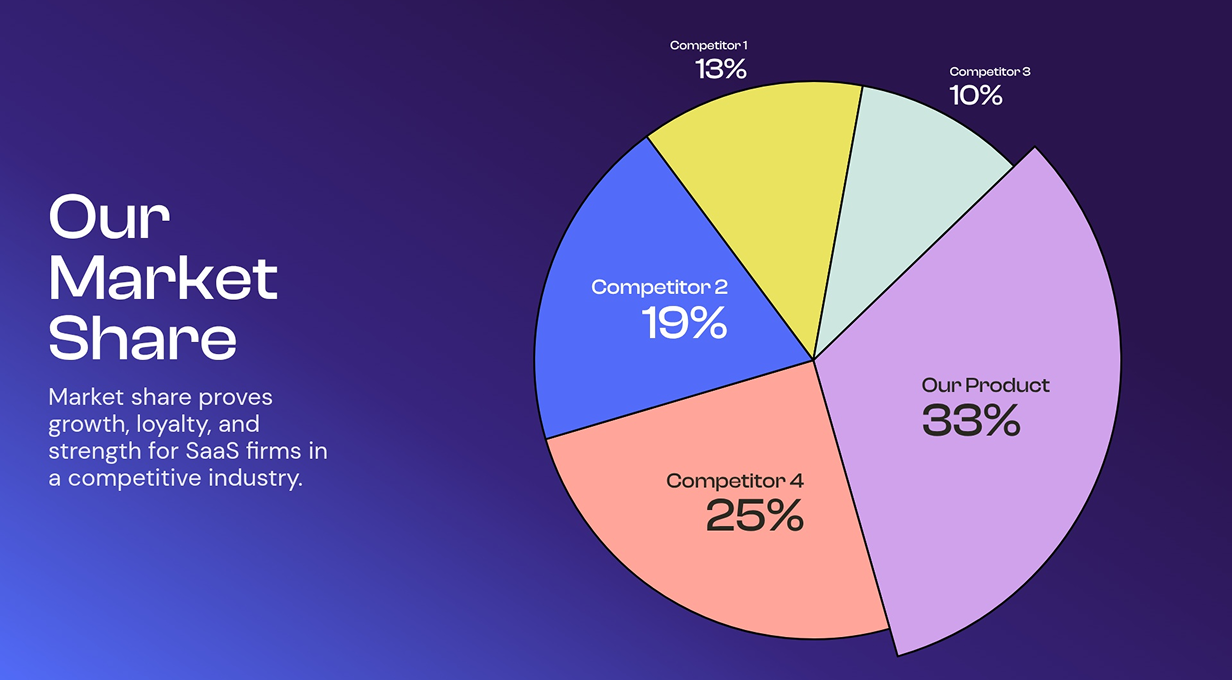
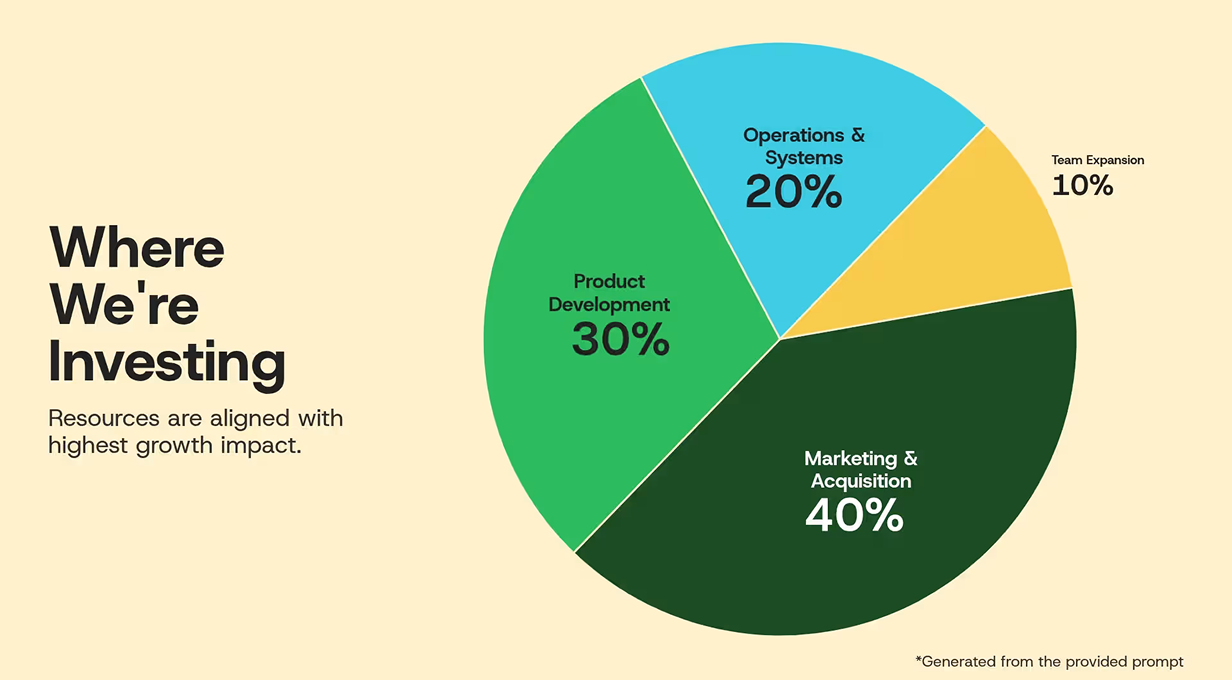
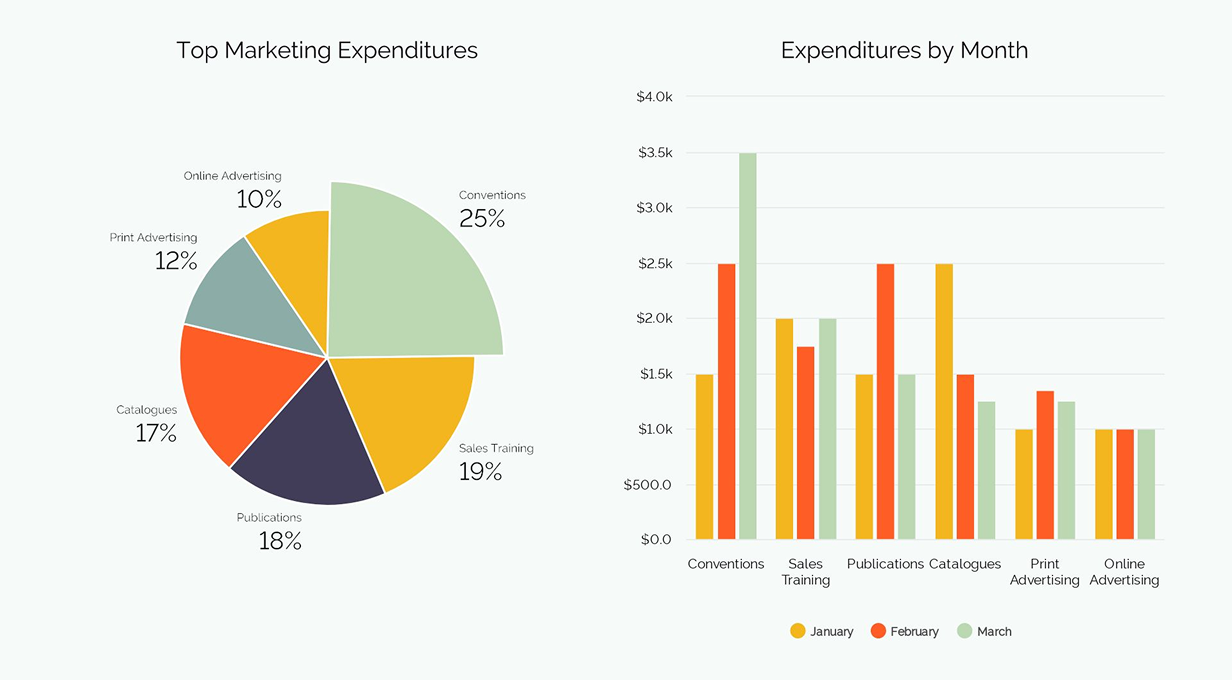
What is a {{template-name}}, and when should you use one?
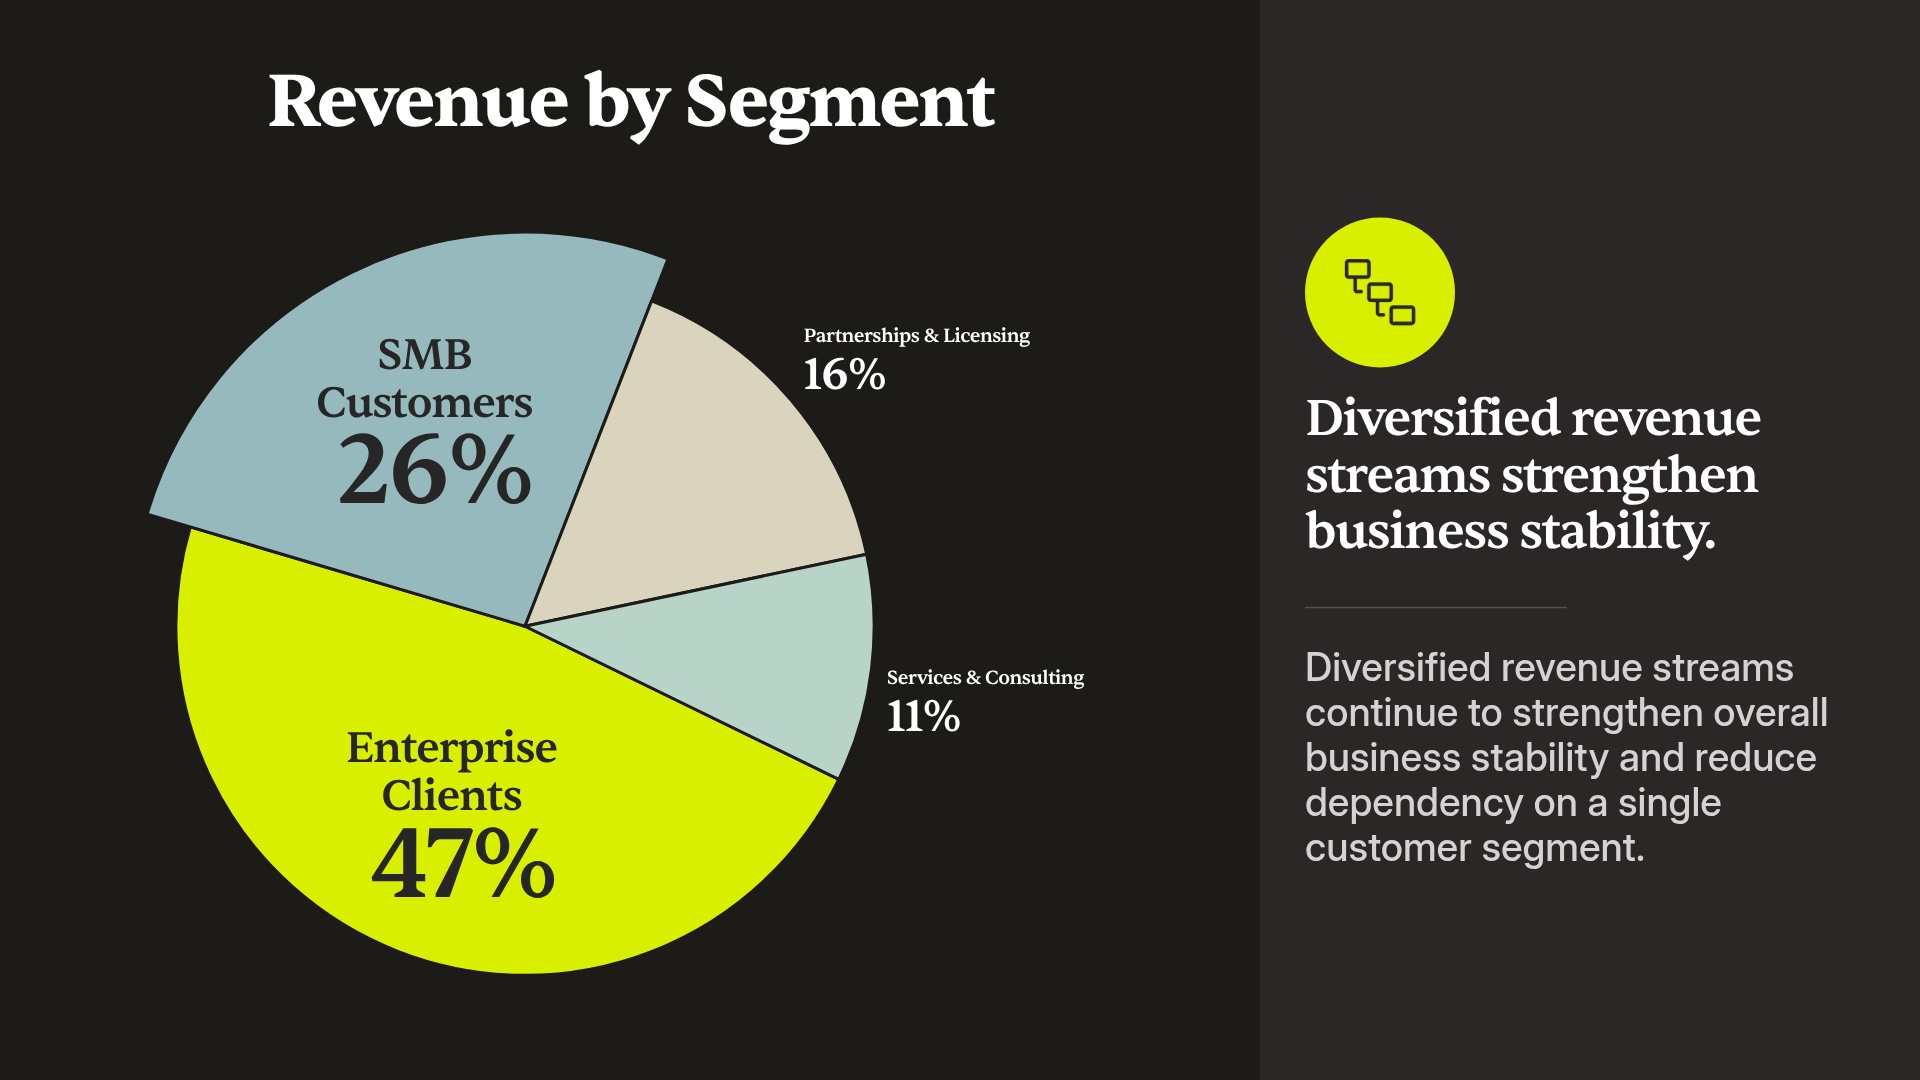
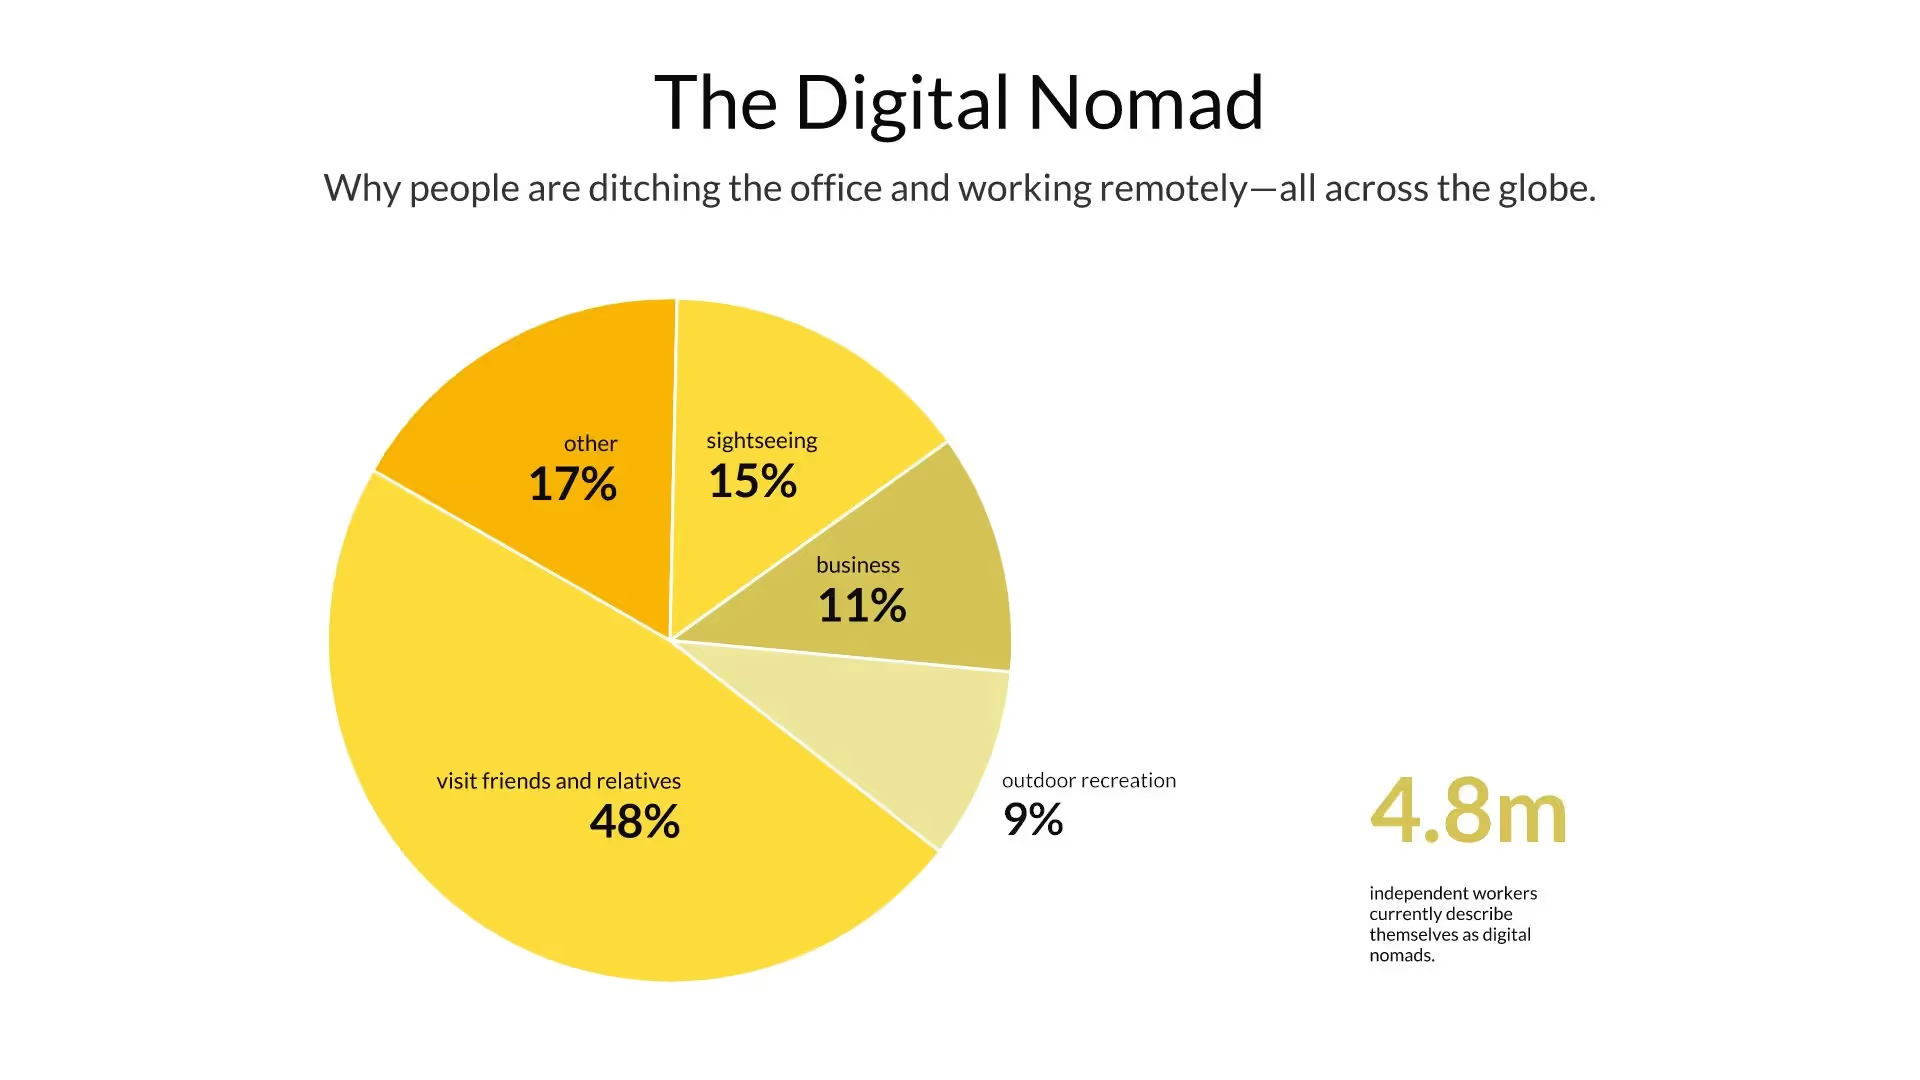
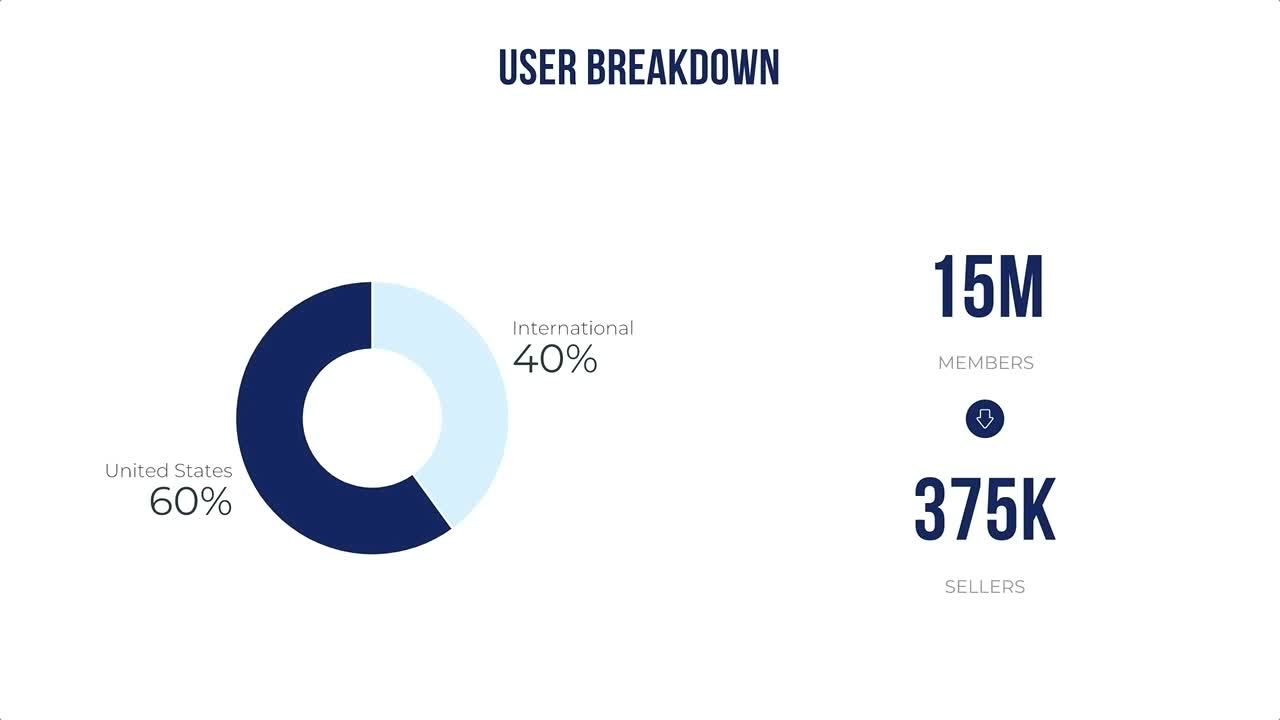
A pie chart is a circular chart that uses “pie slices” to show relative sizes of data. A pie chart compares data, information, and statistics in an easy-to-read format with varying slice sizes telling you how much of one data element exists.
Pie charts are good for showing data for 6 or fewer categories. When there are too many categories, it is difficult for the eye to distinguish between the relative sizes of the different sectors, so the chart becomes difficult to interpret. Used appropriately, pie chart slides are an excellent way to exhibit topics including expenses and profits, segments of a population, or answers to a survey.
Pie charts can be used in many different situations:
- To show the composition of demographic data
- To reflect competitive market share
- To showcase results of a survey
Use the Beautiful.ai pie chart template to add color and design to your presentations. It’s a cinch to convert a mass of data into a simple, clear graphic. Create an editable pie chart template for presentations: the design is done, so you only need to add your data.
How to use the {{template-name}} Template
Open the template
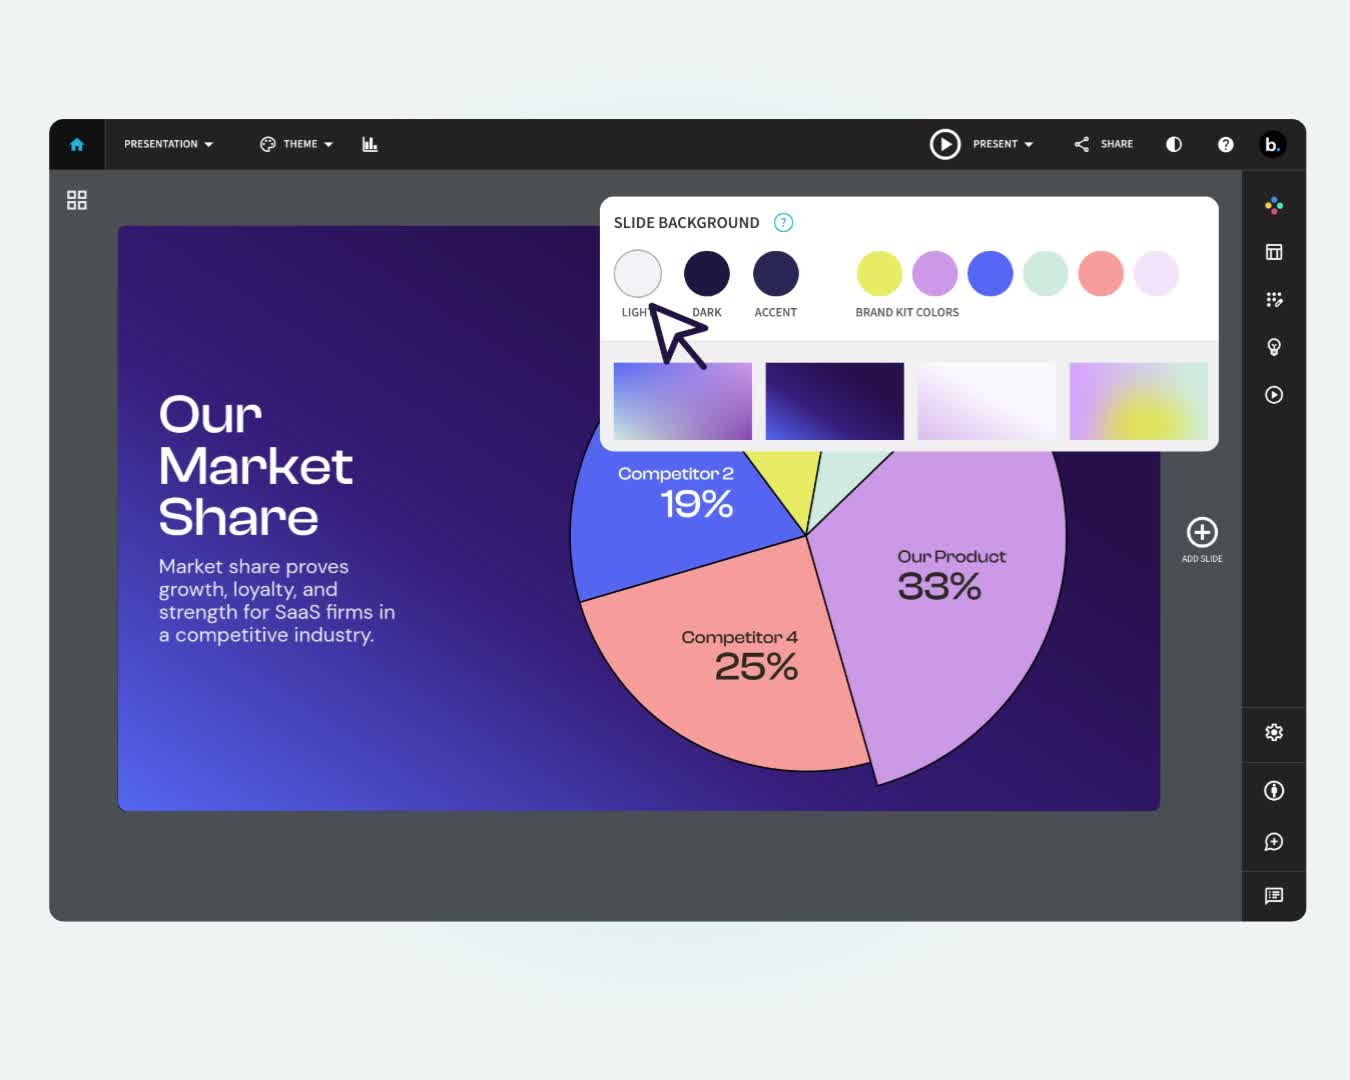
Select Use this template and the Pie Chart slide opens in Beautiful.ai, ready to edit.
Add your data
Type your categories and values straight into the chart, paste a data set, or describe what you are measuring and let AI fill it in.
Make it yours
Adjust colors, labels, and the legend. Smart Slides re-balance the slices and keep the design aligned as the numbers change.
Present or export
Share a live link, present from Beautiful.ai, or export to PowerPoint, Google Slides, or PDF.
Pro Tips for Pie Charts
Here are a few guidelines to create a perfect pie chart.


Color or shade the different pie slices so that they grade from dark to light tones as you move from the first to the last slice.
Don’t just settle for a standard design. Try moving the design elements on your page into different configurations. Explore Elements and easily drag text boxes and call-outs around on your pie chart template.
Our pie chart template allows you to easily add a legend which reduces the amount of text in the pie chart and produces an “at-a-glance” graphic.
Discover AI capabilities for pie chart
With these AI-driven features, you can go beyond static pie charts and create data‑rich, on‑brand, interactive visuals in seconds.
Generate an AI pie chart with a prompt
Add context with AI
Refine copy on a pie chart slide
Create a supporting image
Browse more templates

More {{template-category}} templates


AI-powered Smart Slides that do the design for you
Build your next presentation using Smart Slides—the intelligent building blocks behind every Beautiful.ai presentation. Each Smart Slide is customizable, editable with AI, and automatically adapts layout and spacing as your content changes.


“Beautiful.ai helps us quickly create clear and compelling presentations to share our strategy and results. It has been easy to integrate our branding and to pull from the library of materials created by others — building a cohesive and collaborative suite that helps us advance our mission."

"Beautiful.ai increased our efficiency. I mean, 50% sounds crazy, but it's pretty accurate when you consider all of the manual stuff that we used to have to do that Beautiful.ai now does for us."

"What you guys have created is a foolproof way to ensure quality presentations. It's almost just like they have a graphic designer over their shoulder while they're creating their decks."

“For any business owner or entrepreneur where time is of the essence you lose the ability to put those nice touches on presentations, Beautiful.ai does it for you, especially if you aren't creatively gifted!”
Ready-to-use presentation templates for creating full, polished decks.



Pitch Decks



Reports & Reviews



Plans & Strategies
Try it free for 14 days
Start building Beautiful presentations.

