Blog
.png)
Featured
/
6
Min Read
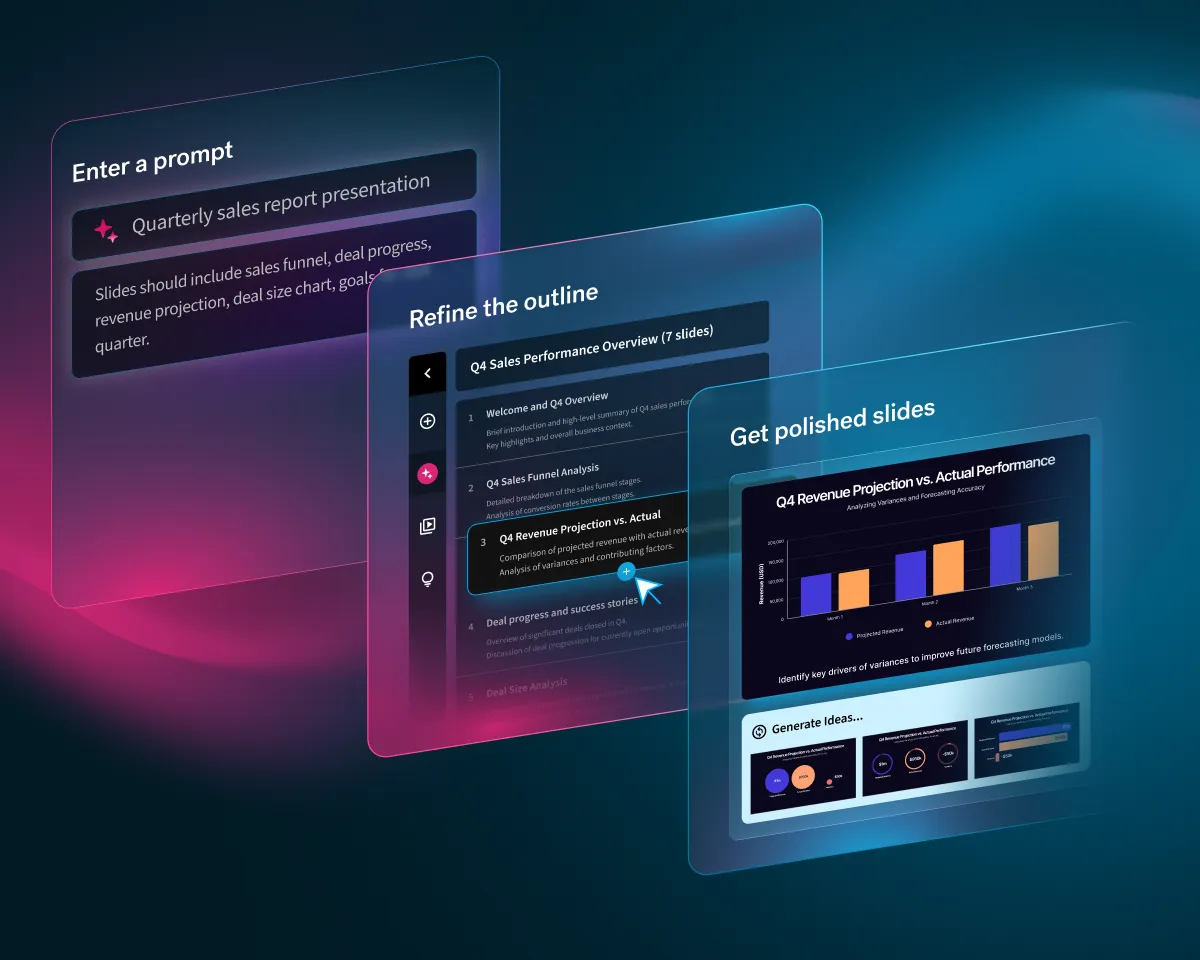
How People are Actually Using AI (and What it Means for the Future)
AI is changing work through everyday tasks like writing, summarizing, and creating presentations. Explore the workplace habits driving lasting productivity.
Featured
/
6
Min Read
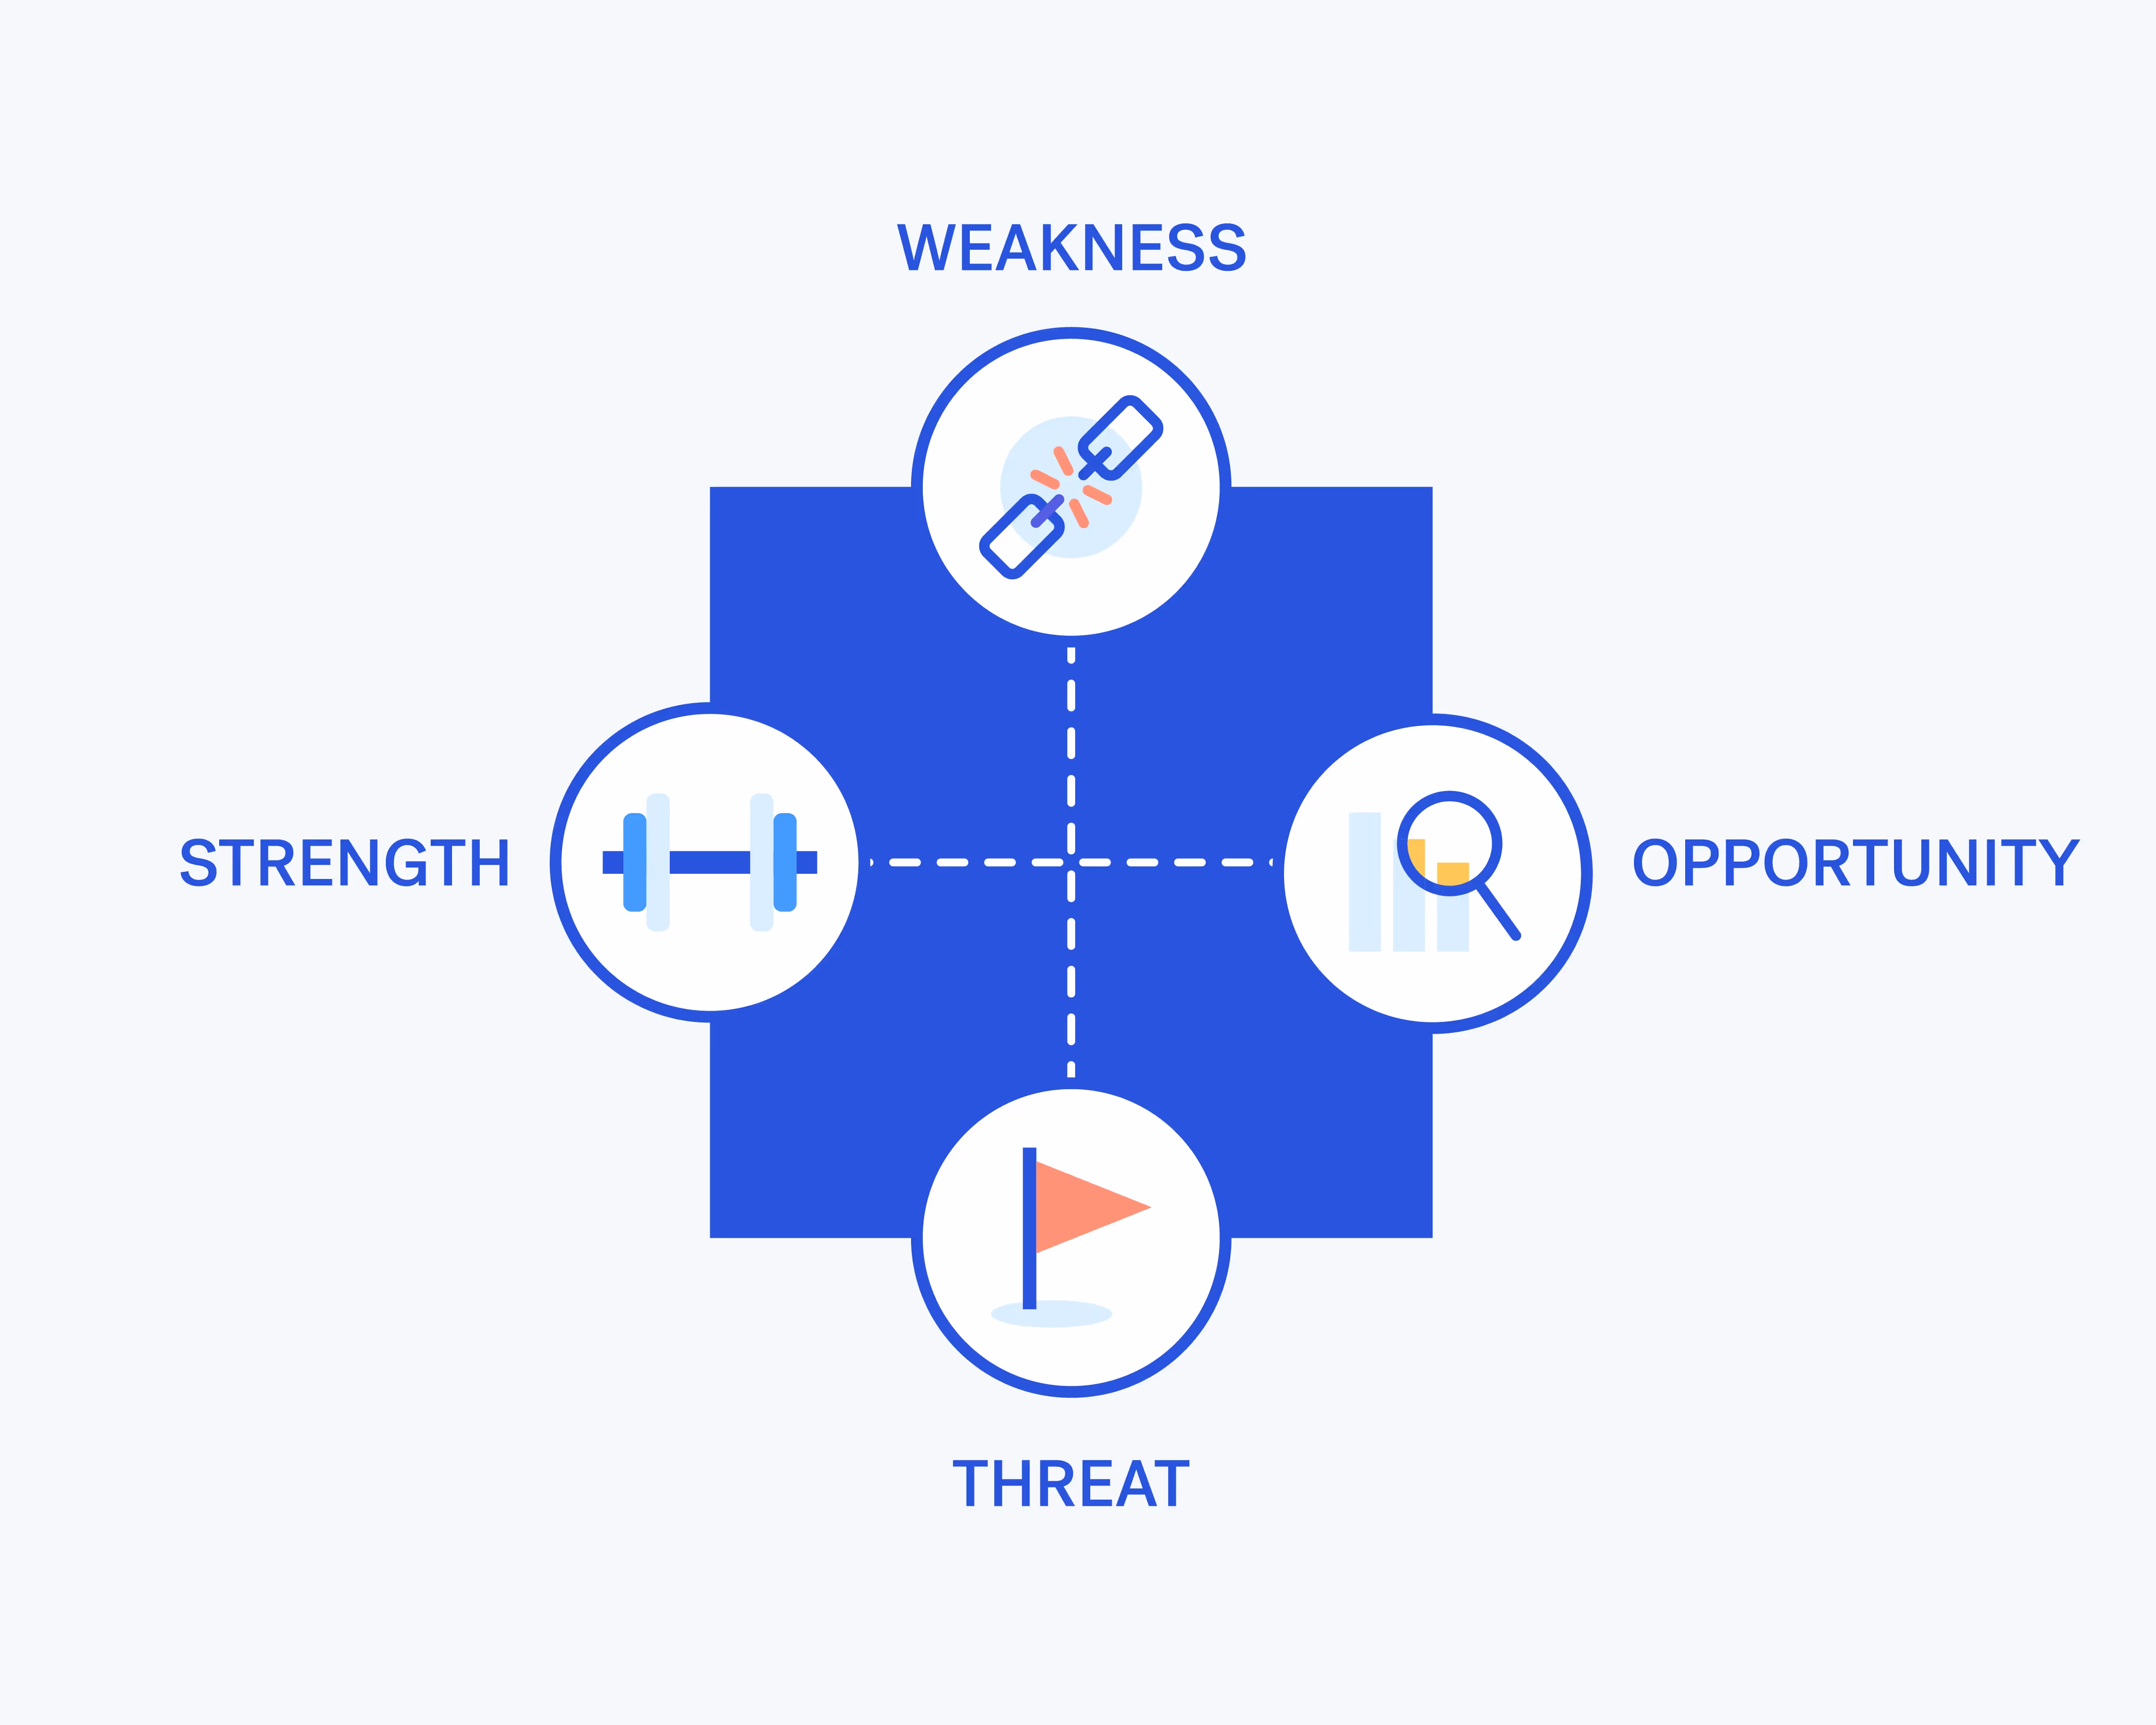
Team SWOT Analysis: How to Create One for Your Team
A team SWOT analysis helps your group spot strengths, weaknesses, opportunities, and threats. Learn how to run one in 7 steps, with real examples and a free template.
Featured
/
7
Min Read
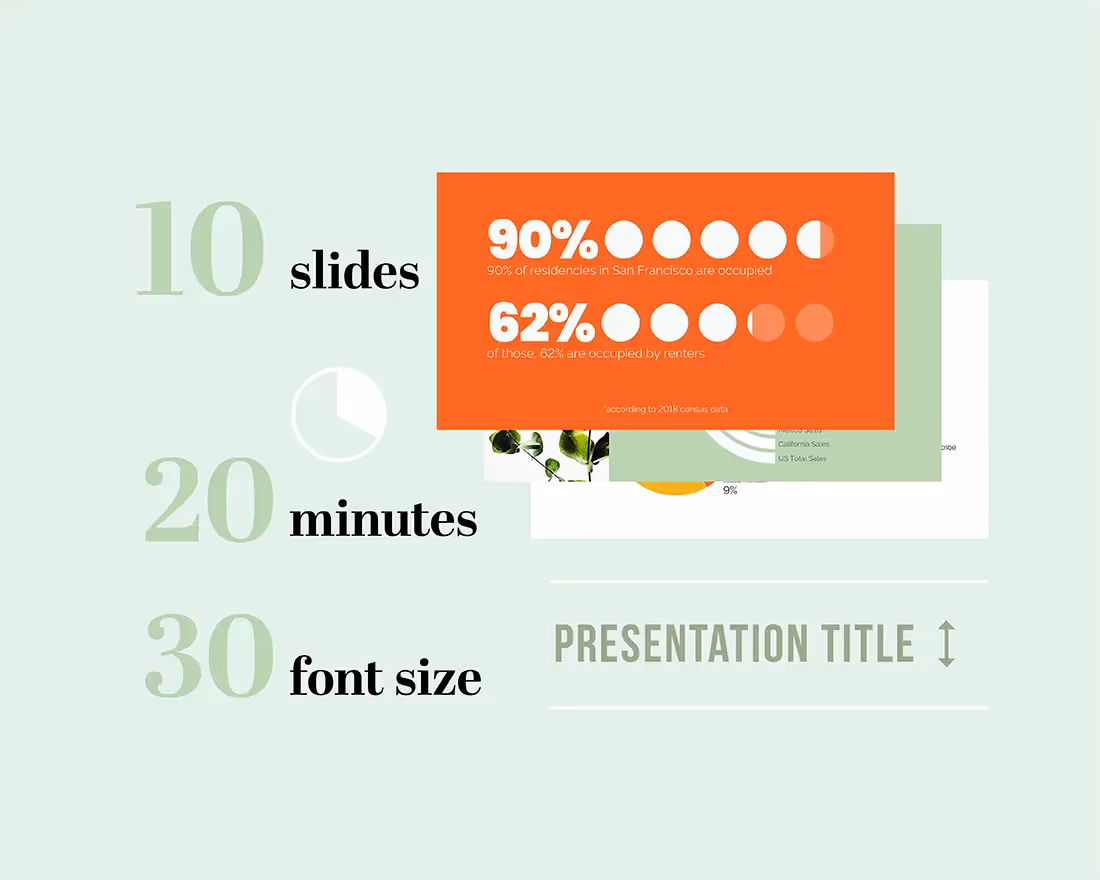
What Is The 10/20/30 Rule For Presentations And Why It's Important For Your Team
The 10/20/30 rule for presentations means 10 slides, 20 minutes, and 30-point font. Learn how Guy Kawasaki's rule keeps decks focused, and how to apply it.

Featured
/
6
Min Read
50 College Presentation Ideas to Nail Your Next Class Project
Need college presentation ideas? Browse 50 creative presentation topics for college students, grouped by theme, plus tips for picking the best topic for any class.
.gif)

.gif)
.gif)
.png)
.webp)
.gif)
.png)

.png)

.gif) Data Visualization Trends for Presentations in 2026
Data Visualization Trends for Presentations in 2026.avif) Data Storytelling That Works: 5 Proof-Backed Frameworks for Communicating Insights Clearly
Data Storytelling That Works: 5 Proof-Backed Frameworks for Communicating Insights Clearly.avif) How Do I Present Research Findings Effectively?
How Do I Present Research Findings Effectively?.gif)
.gif)
.gif)

.avif)
.gif)
.png)
.png)
.png)