.gif)

Are you tired of staring blankly at a bare presentation slide? We don’t blame you. For non-designers, creating a presentation from scratch can be a tiresome feat. We all know that time is money, especially when you’re working relentlessly to scale your business. Many people don’t have the extra hours to spend aligning text boxes and picking appropriate font sizes. Using dated platforms that force you to start from scratch with little-to-no guidance, like PowerPoint, is an efficiency killer. Instead, your time should be spent fine-tuning your business plan, nailing your story, or preparing for your pitch. The good news? There’s a template for that.
It’s time to get unstuck, and start inspired with Beautiful.ai.
In our latest release, we added a new inspiration gallery to help you start inspired. We’ve always had smart slide templates, but now we offer inspiration slides to help get you started when you’re feeling stuck. Choose from hundreds of beautiful, pre-built slides to add to your presentation. Since these slides were created with our smart templates, you can easily customize them with your own content. It’s easy! Just click "Add slide" and "Get Inspiration" to browse the gallery.
Here are our top 10 most popular pre-built templates.
Calendar
When you need to share important project dates or milestones with your team, add a calendar slide to your next presentation. Organizing your schedule into a calendar format can help people memorize and recall dates more easily. A calendar slide makes more of an impact than a long list of dates in bullet points, and can be easier to read and reference at a glance than more complicated project management charts.
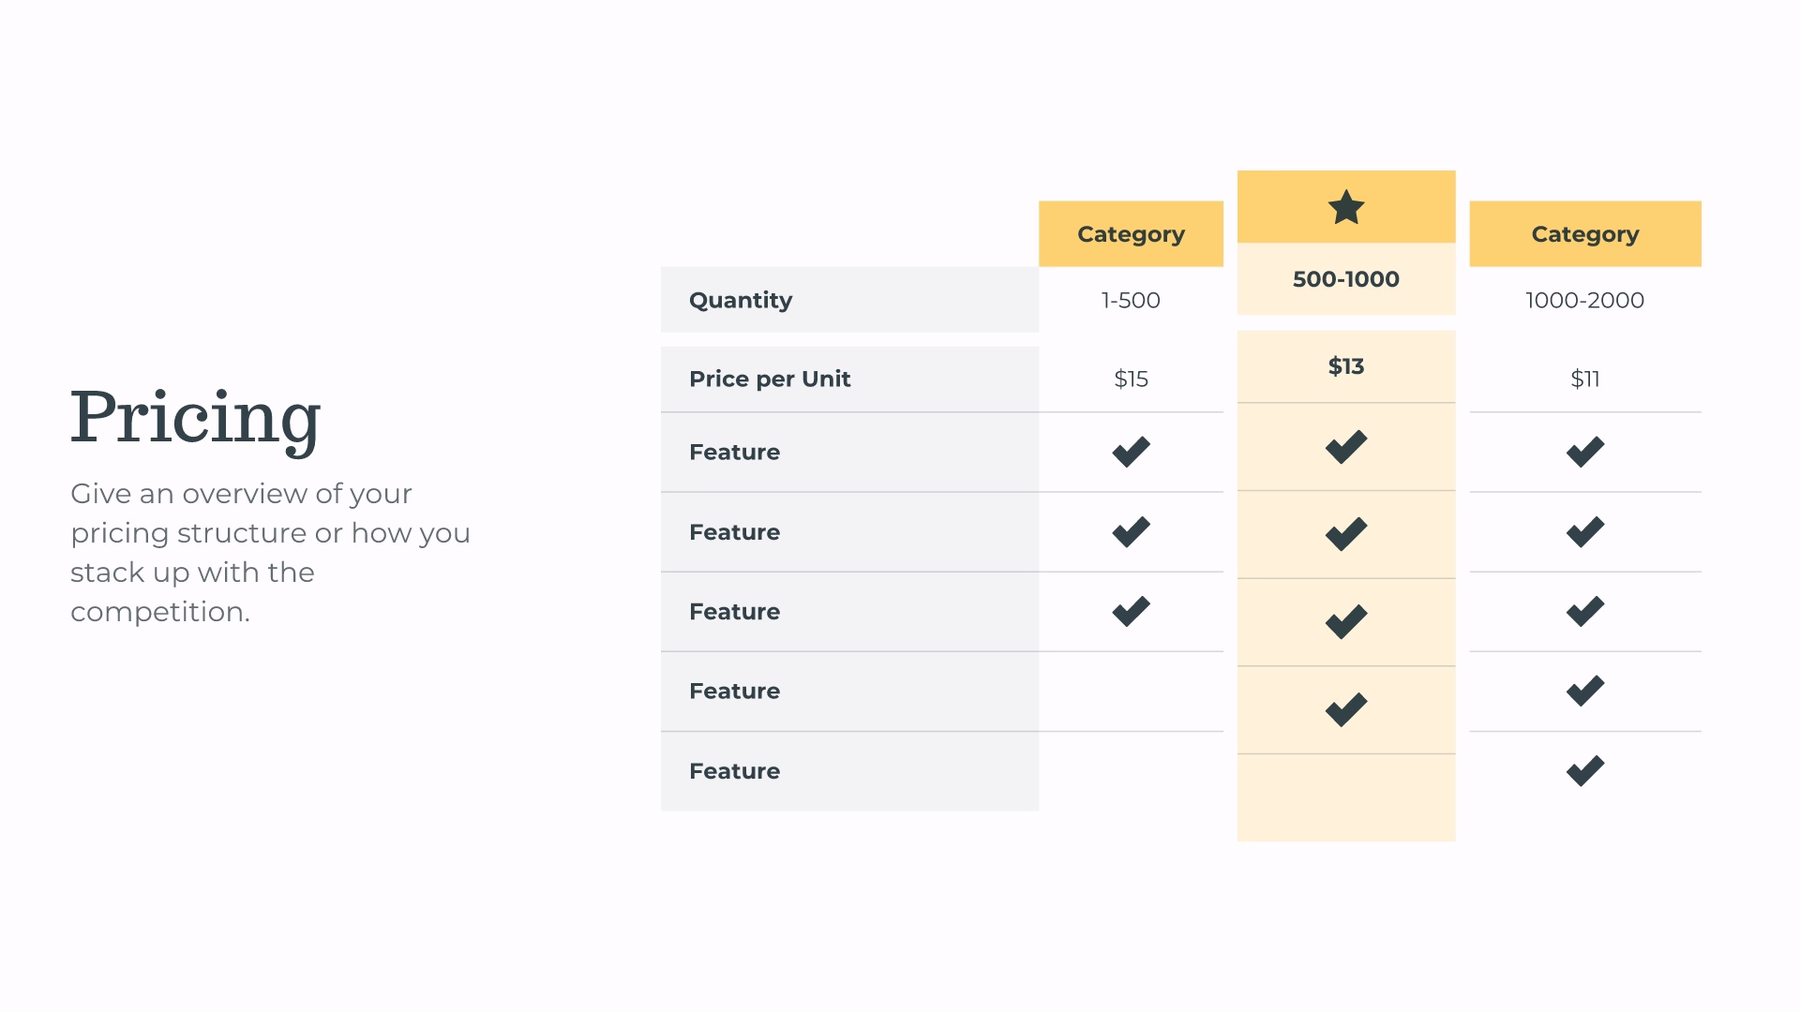
Table
Tables are used to organize data that is overly detailed or complicated, allowing the reader to quickly see the results. A table slide can be used in a presentation to highlight trends or patterns in the data and to make information more readable by removing complex numeric data from the text. Typically, tables arrange data in rows or columns, but can be created with more detail if needed. Tables are widely used in communication, research, and data analysis.
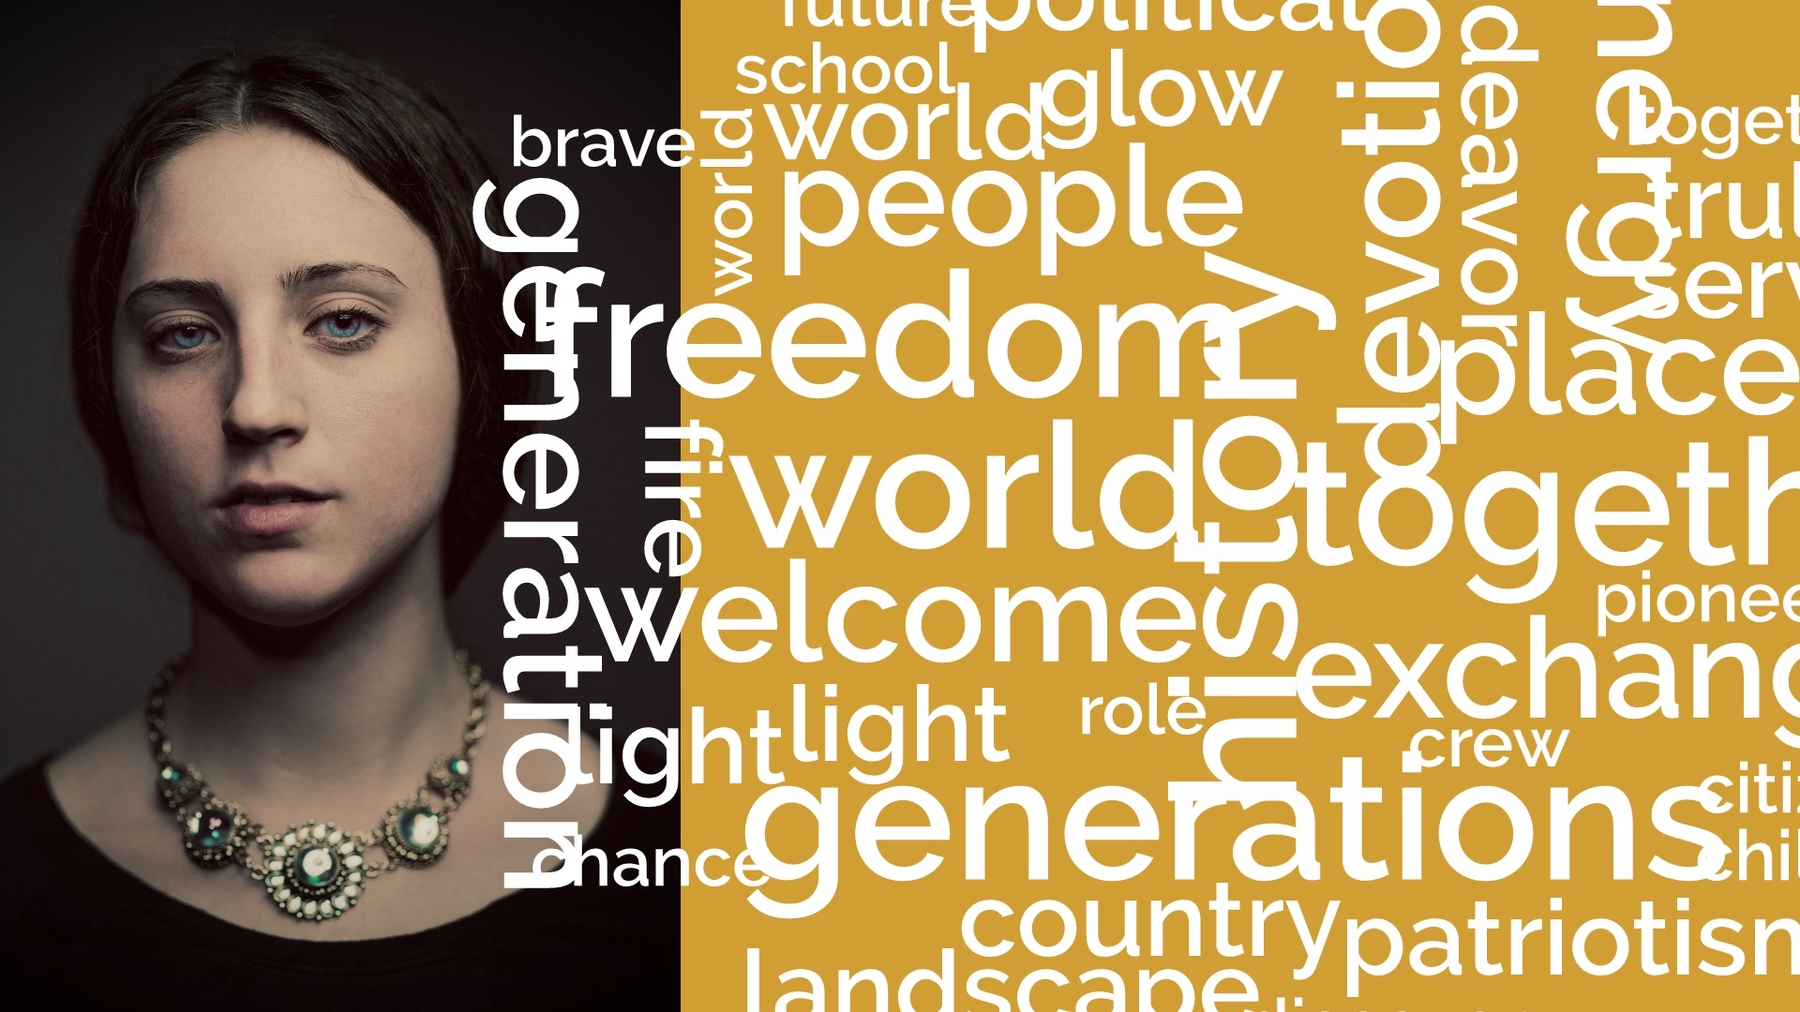
Word Cloud
A word cloud is a collection, or cluster, of words depicted in different sizes. The bigger and bolder the word appears, the more often it’s mentioned within a given text and the more important it is. But let’s be honest: most people use word clouds because they look cool, especially when they’re animated. Word cloud slides are a great tool for presenters who are looking to communicate the importance or frequency of words used in relation to one another.
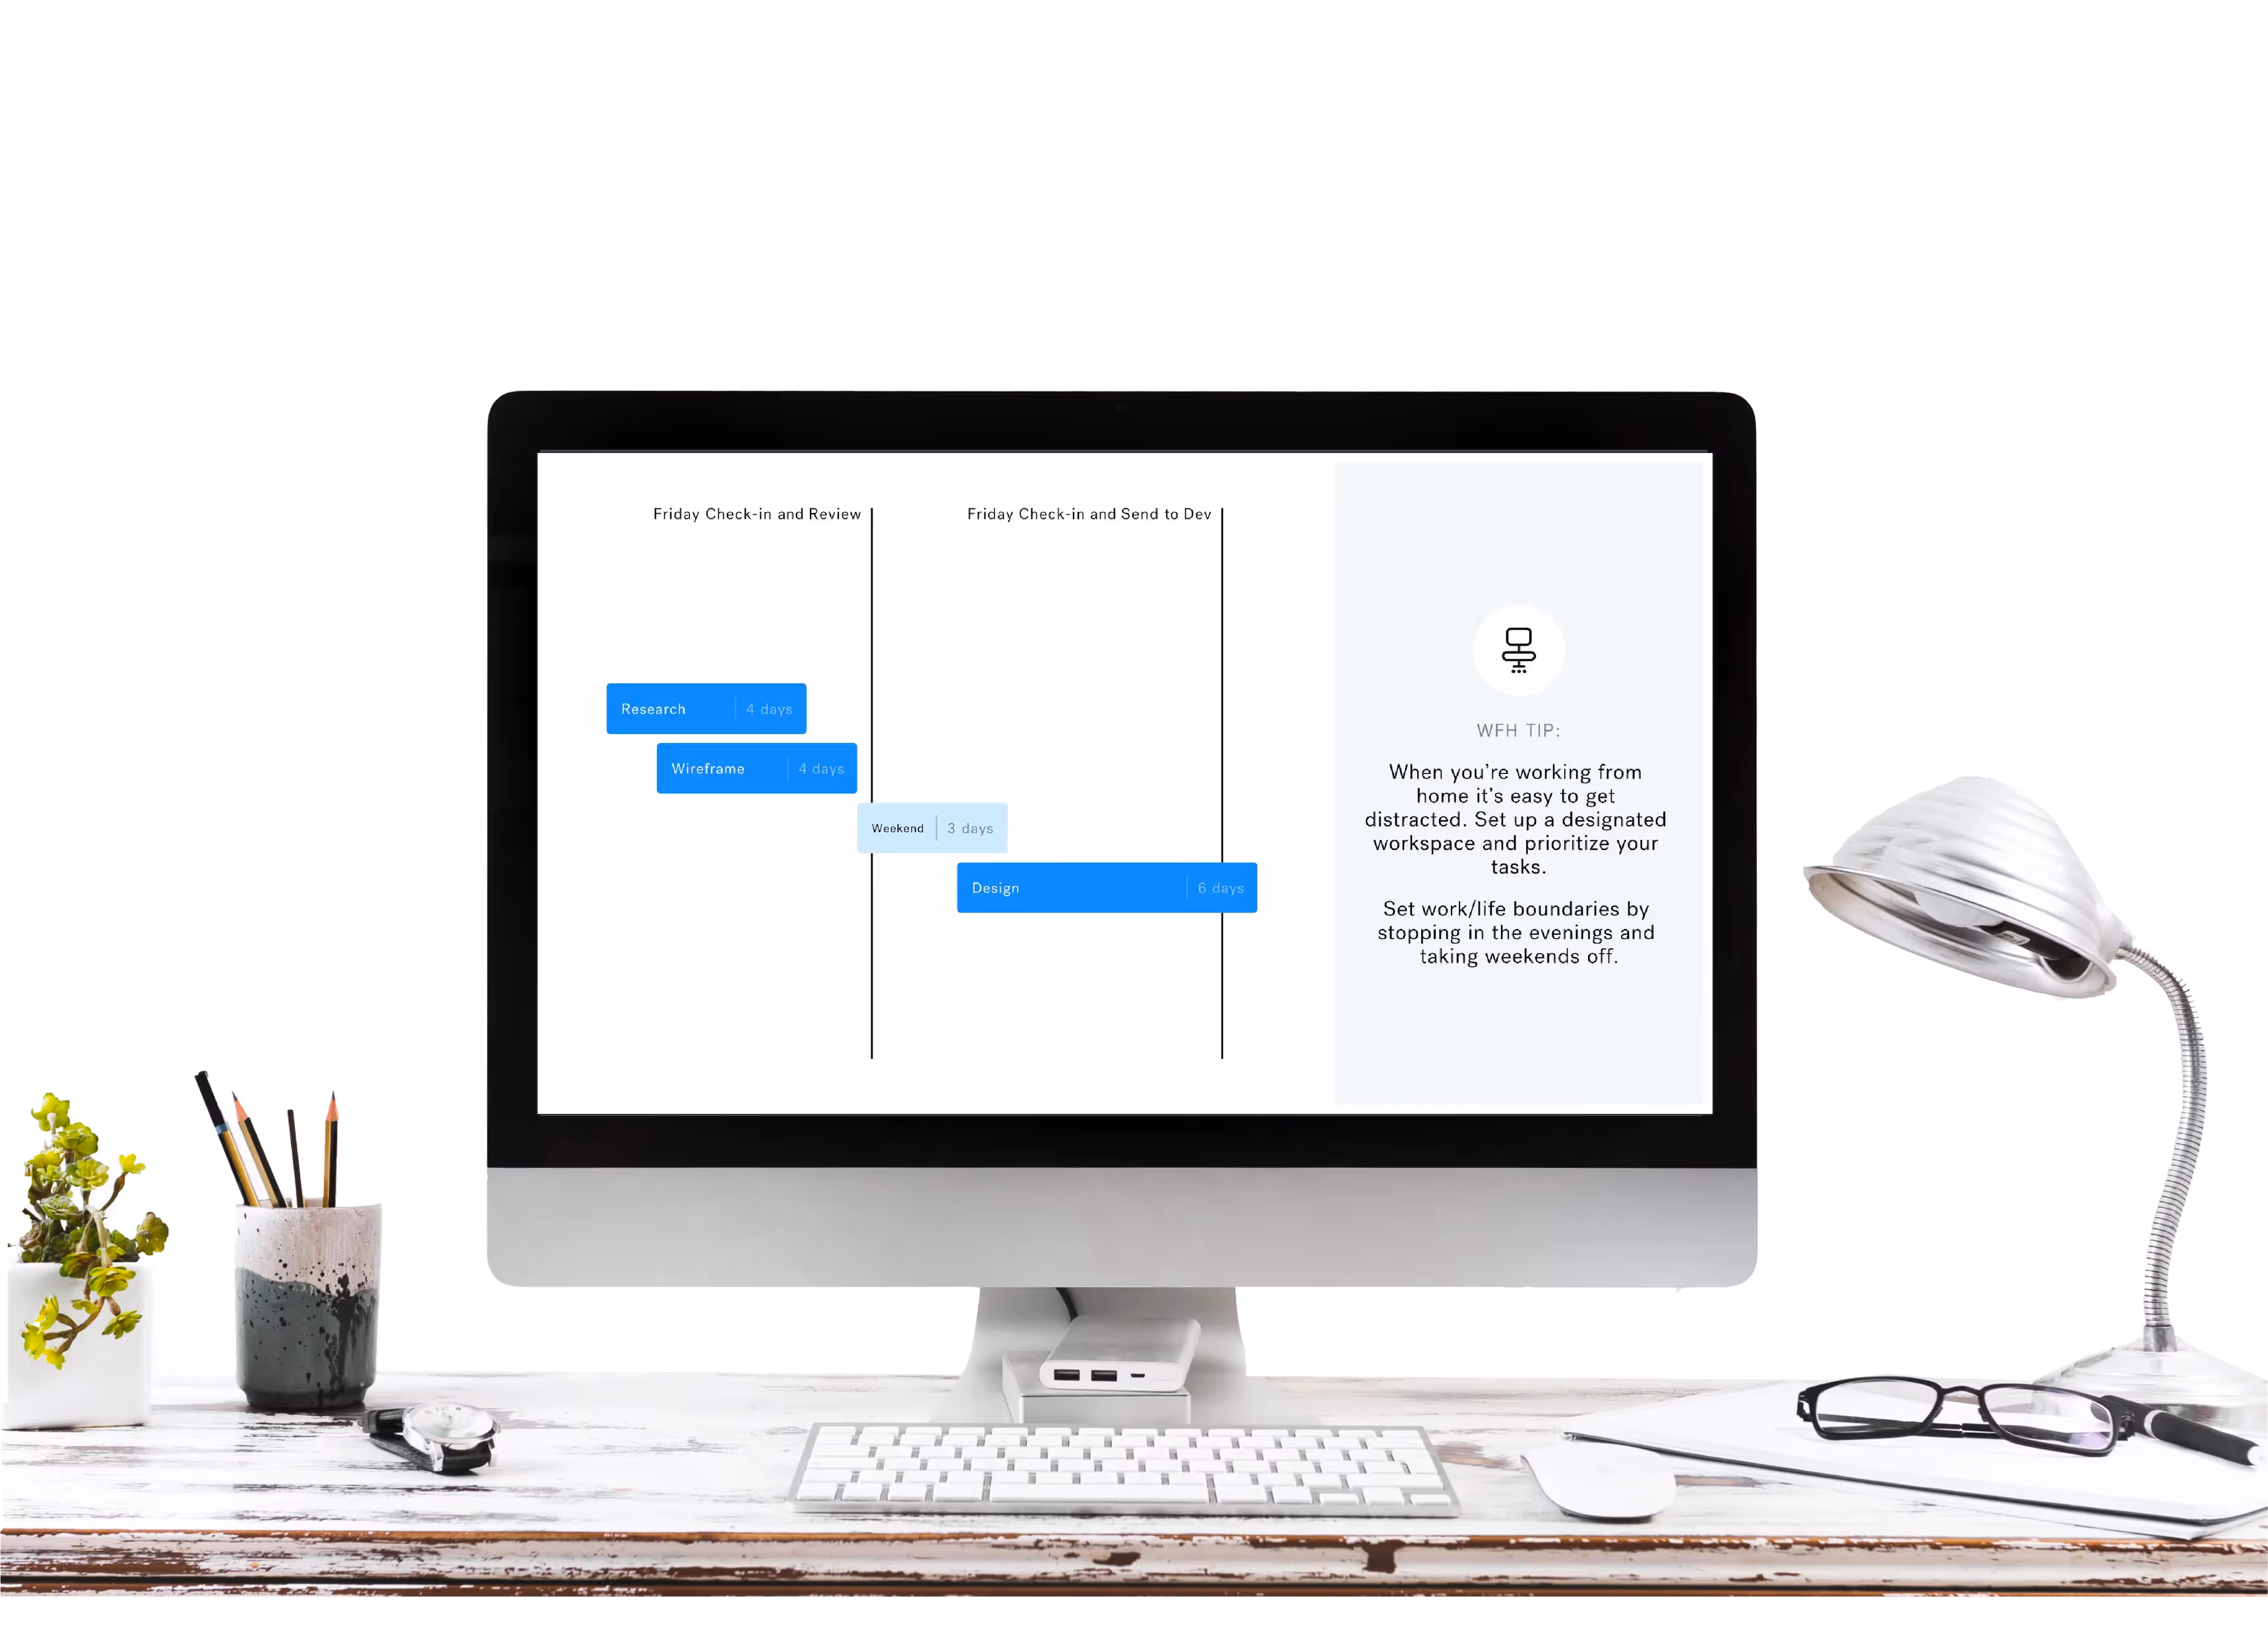
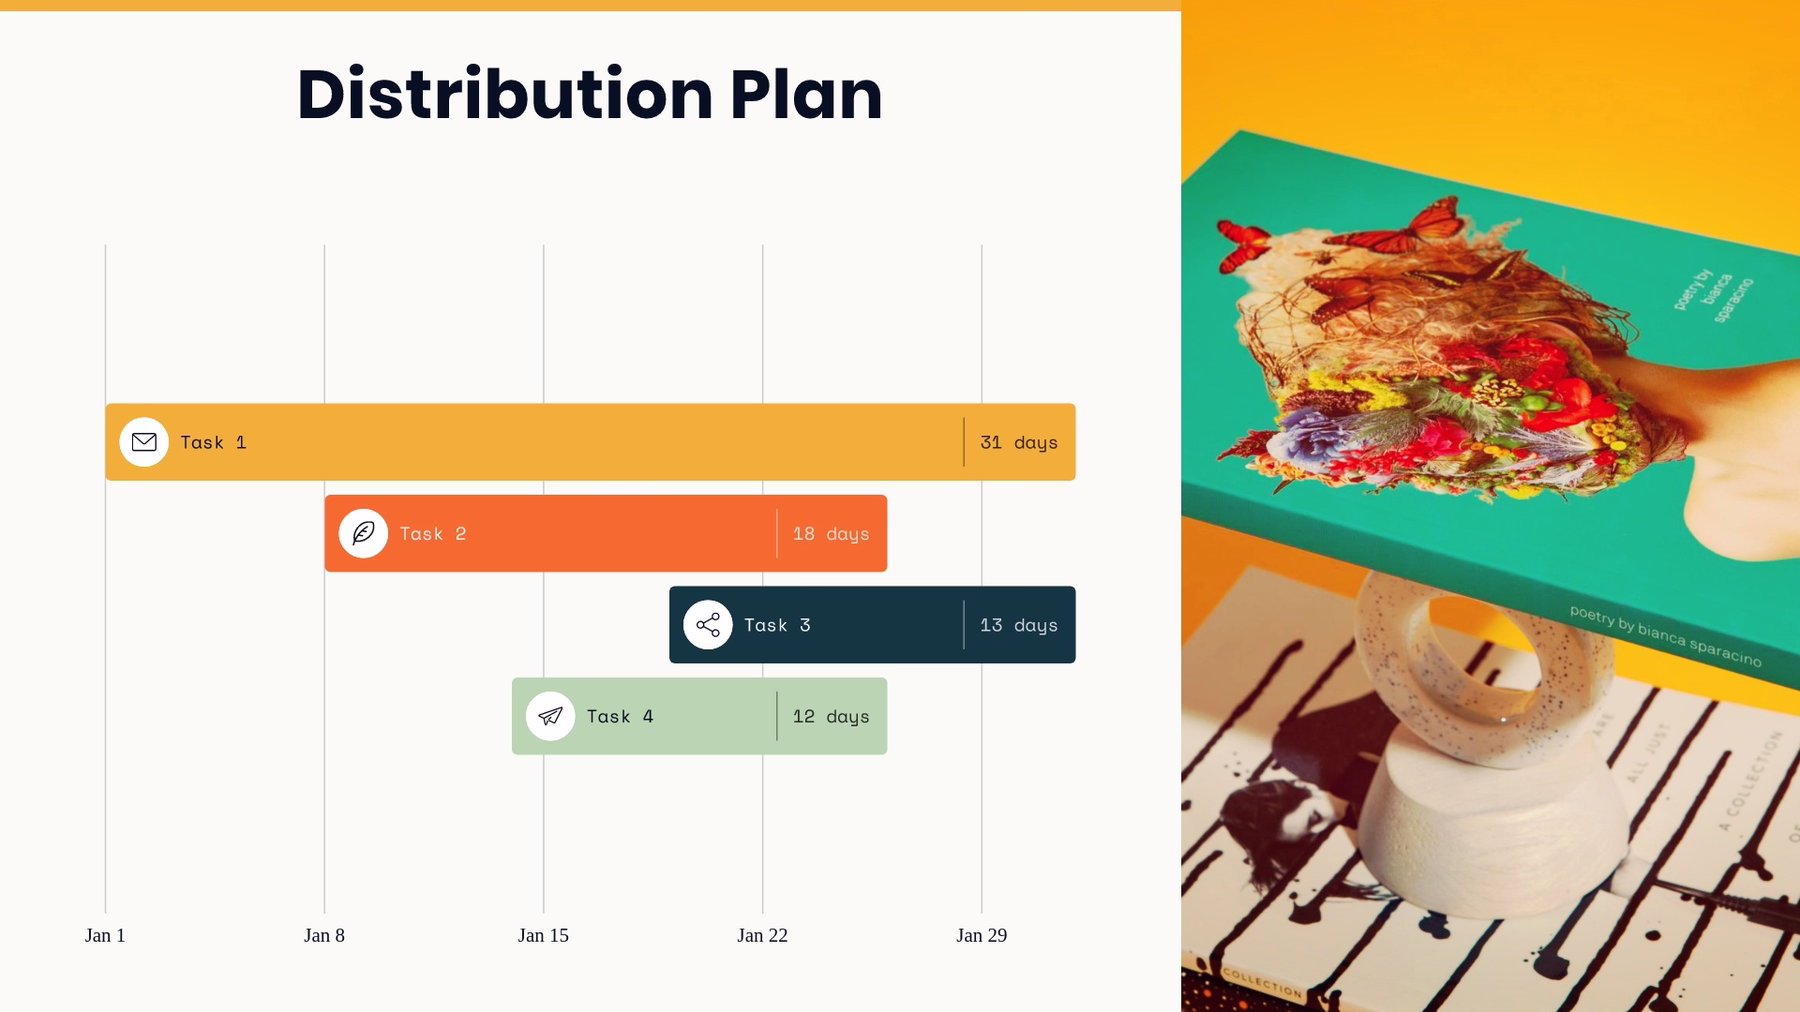
Gantt
A Gantt chart is a visual view of tasks scheduled over time. Invented by Henry Gantt, an American mechanical engineer, it's a type of bar chart that shows the start and finish dates of several elements of a project that include: what the project tasks are, who is working on each task, how long each task will take, and how tasks group together, overlap, and link with each other.
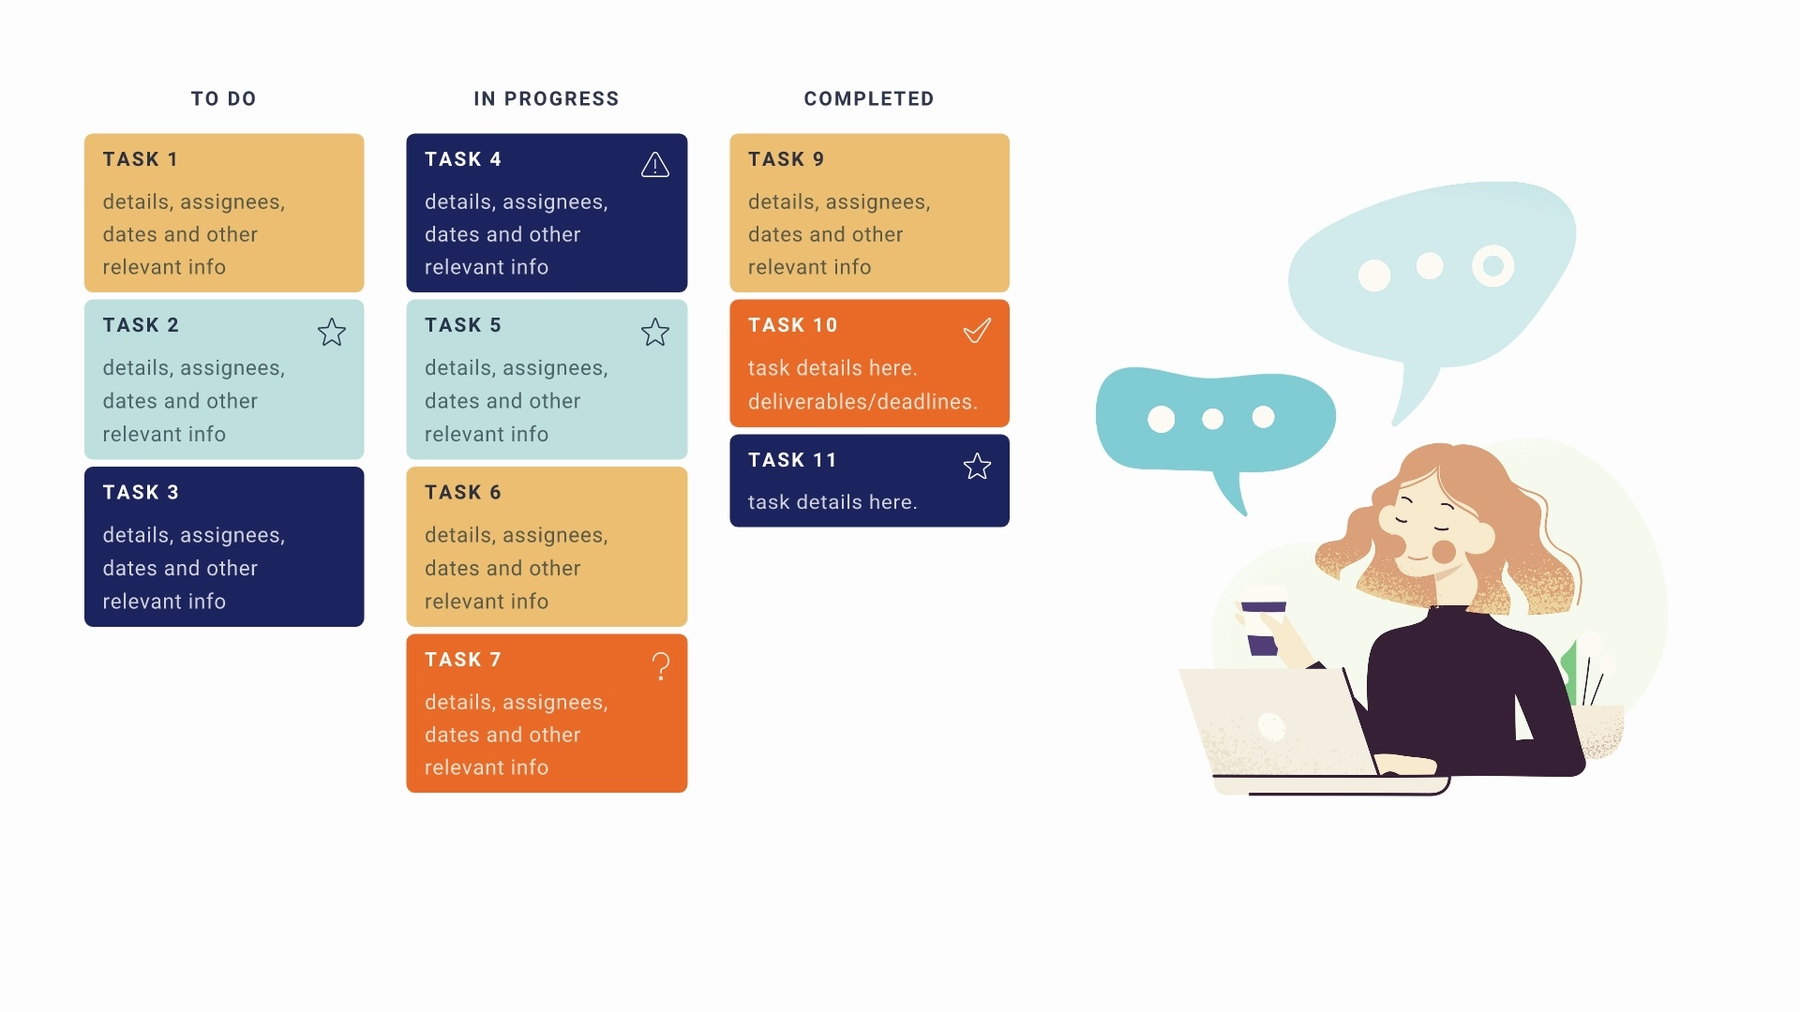
Kanban
Many companies and organizations use a kanban board (also called a kanban system, or simply kanban) to visualize tasks and manage workflows. In a kanban board, each “card” represents a task, which can be organized and moved around based on their current progress. Columns indicate stages of progress, such as brainstorming, production, testing, or completed.
When kanban was first developed by Toyota in the 1940s, teams used paper cards. Now, you can easily customize and add a kanban chart template to your next presentation.
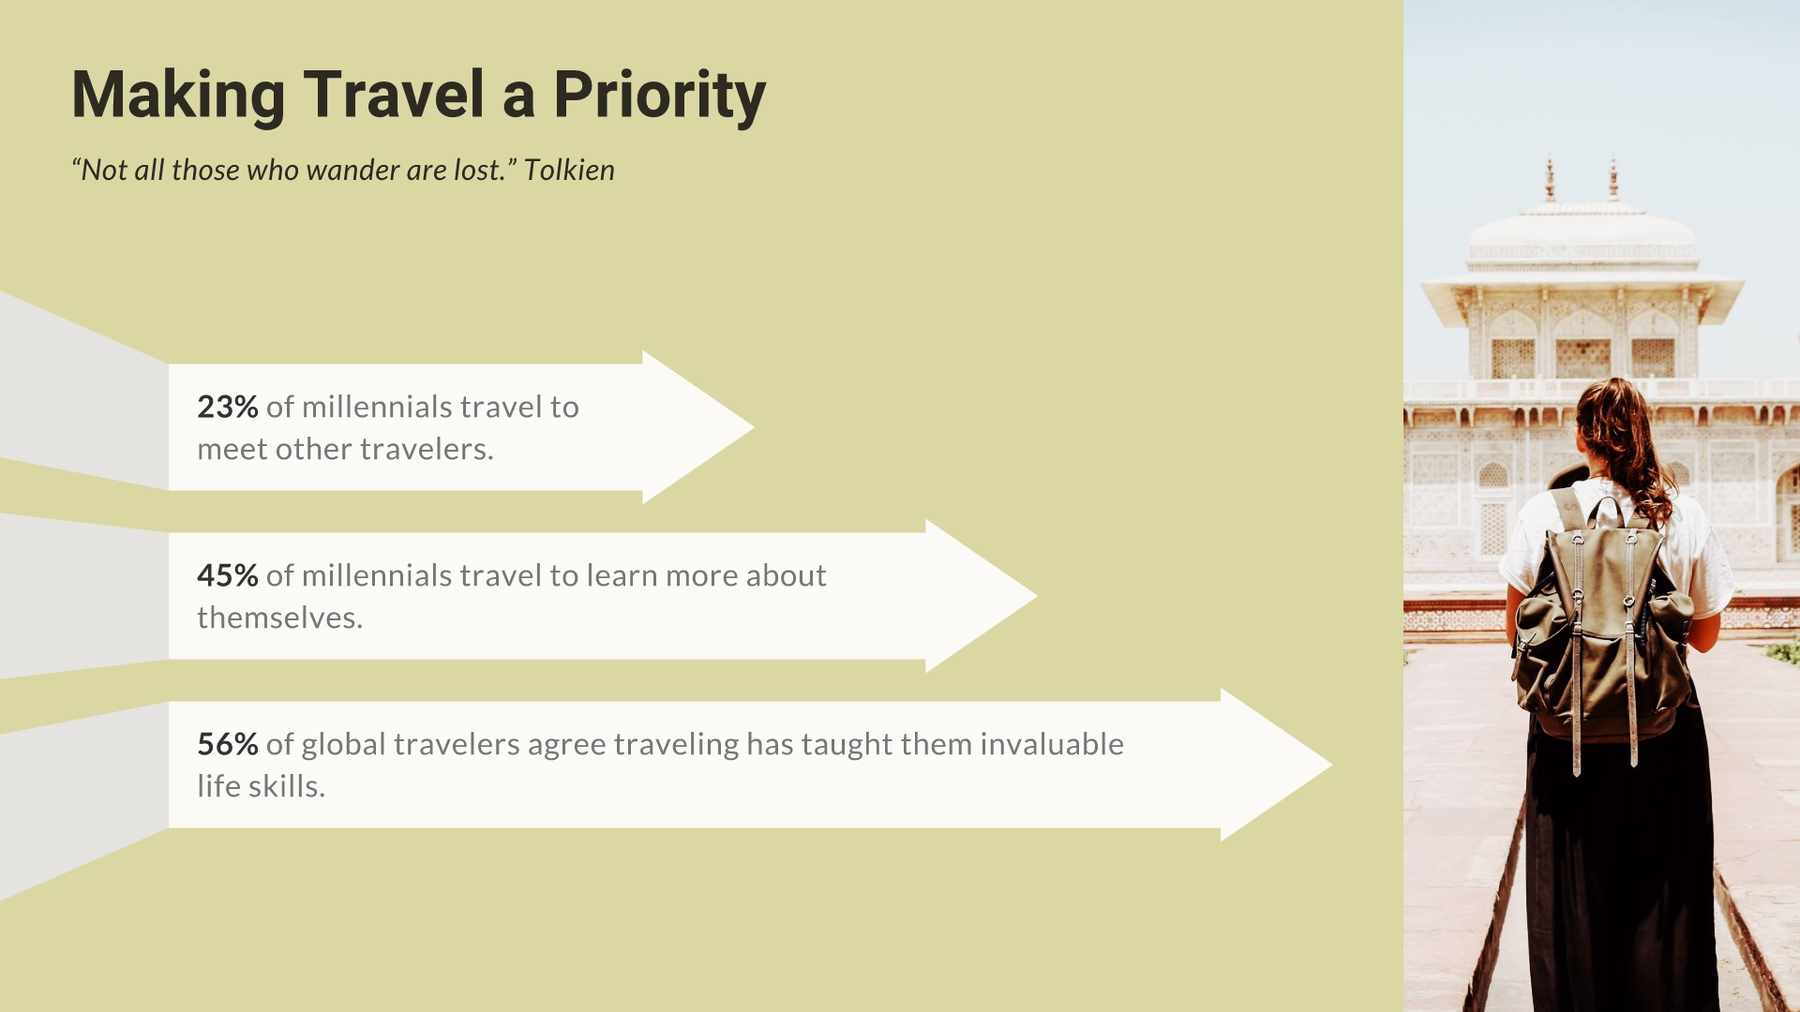
Arrow bars
Need to dress up a plain list of data? An infographic presentation slide displays your data in an interesting, impactful way. Instead of adding a regular bullet list to a slide, an infographic slide uses arrow bars to organize your data. Arrow bars can imply relationships or movement between data points, explain steps to achieve a goal, or make any list in your presentation look well-designed.
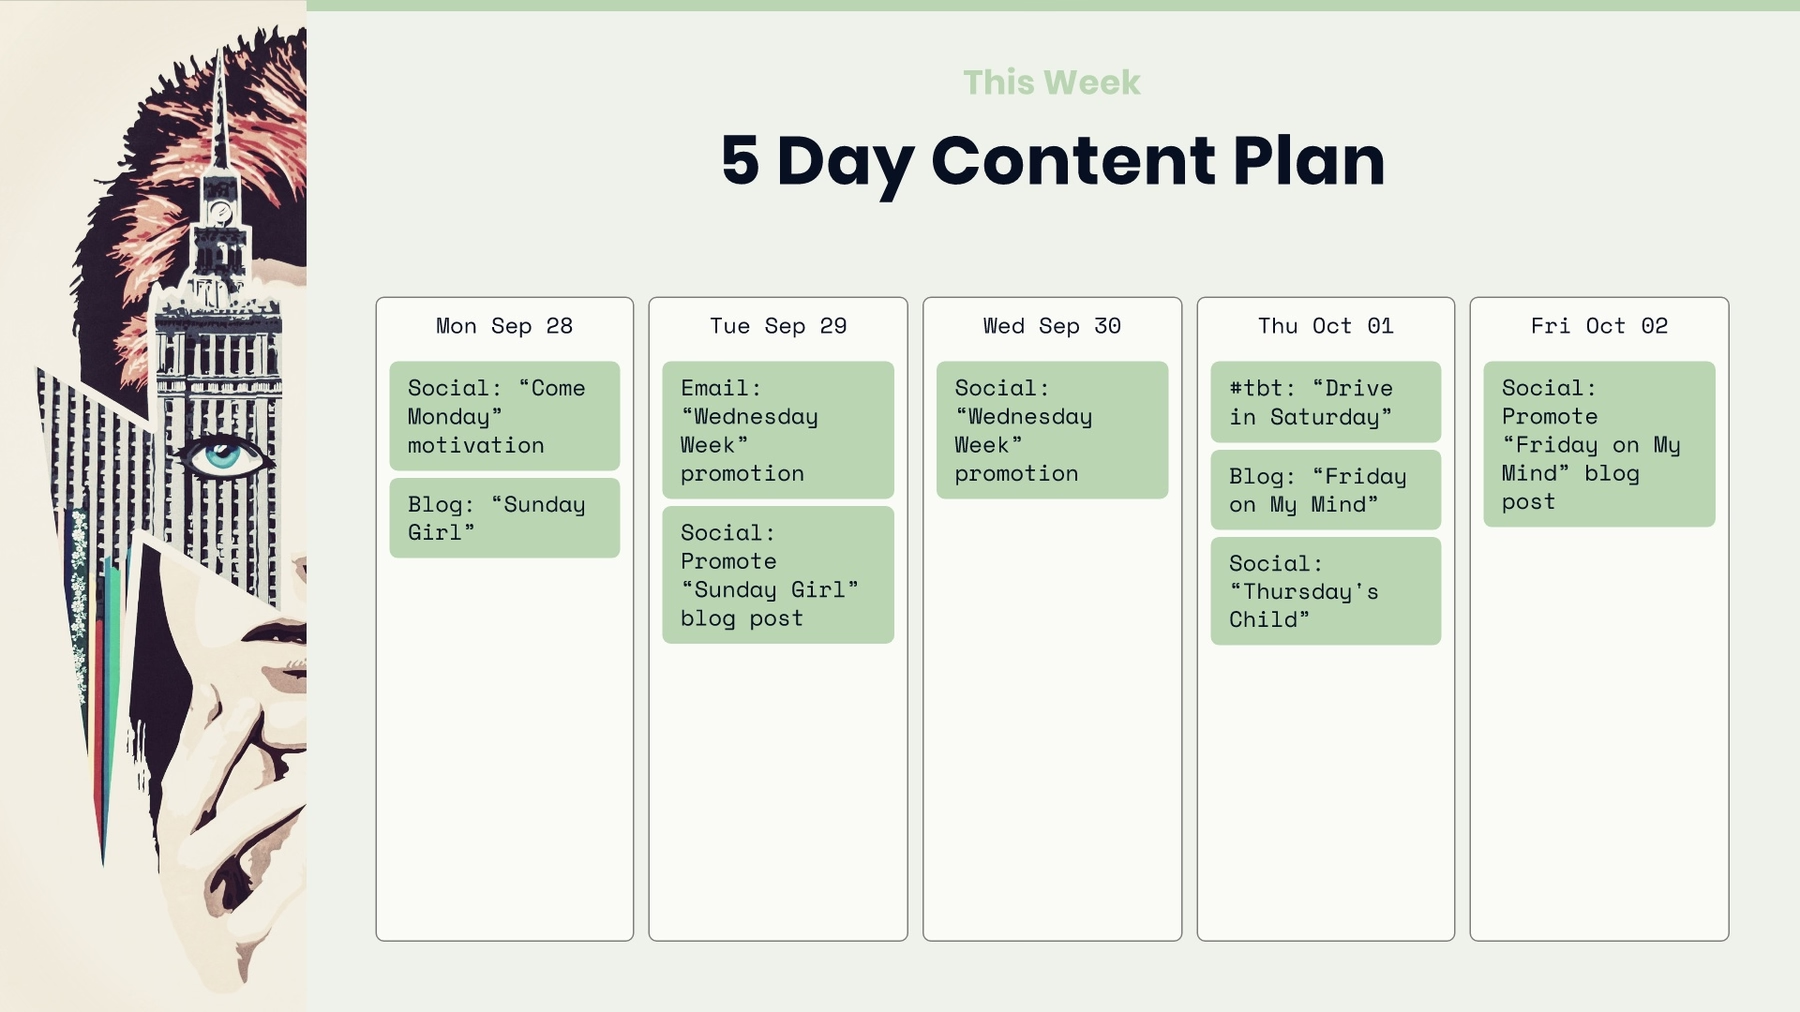
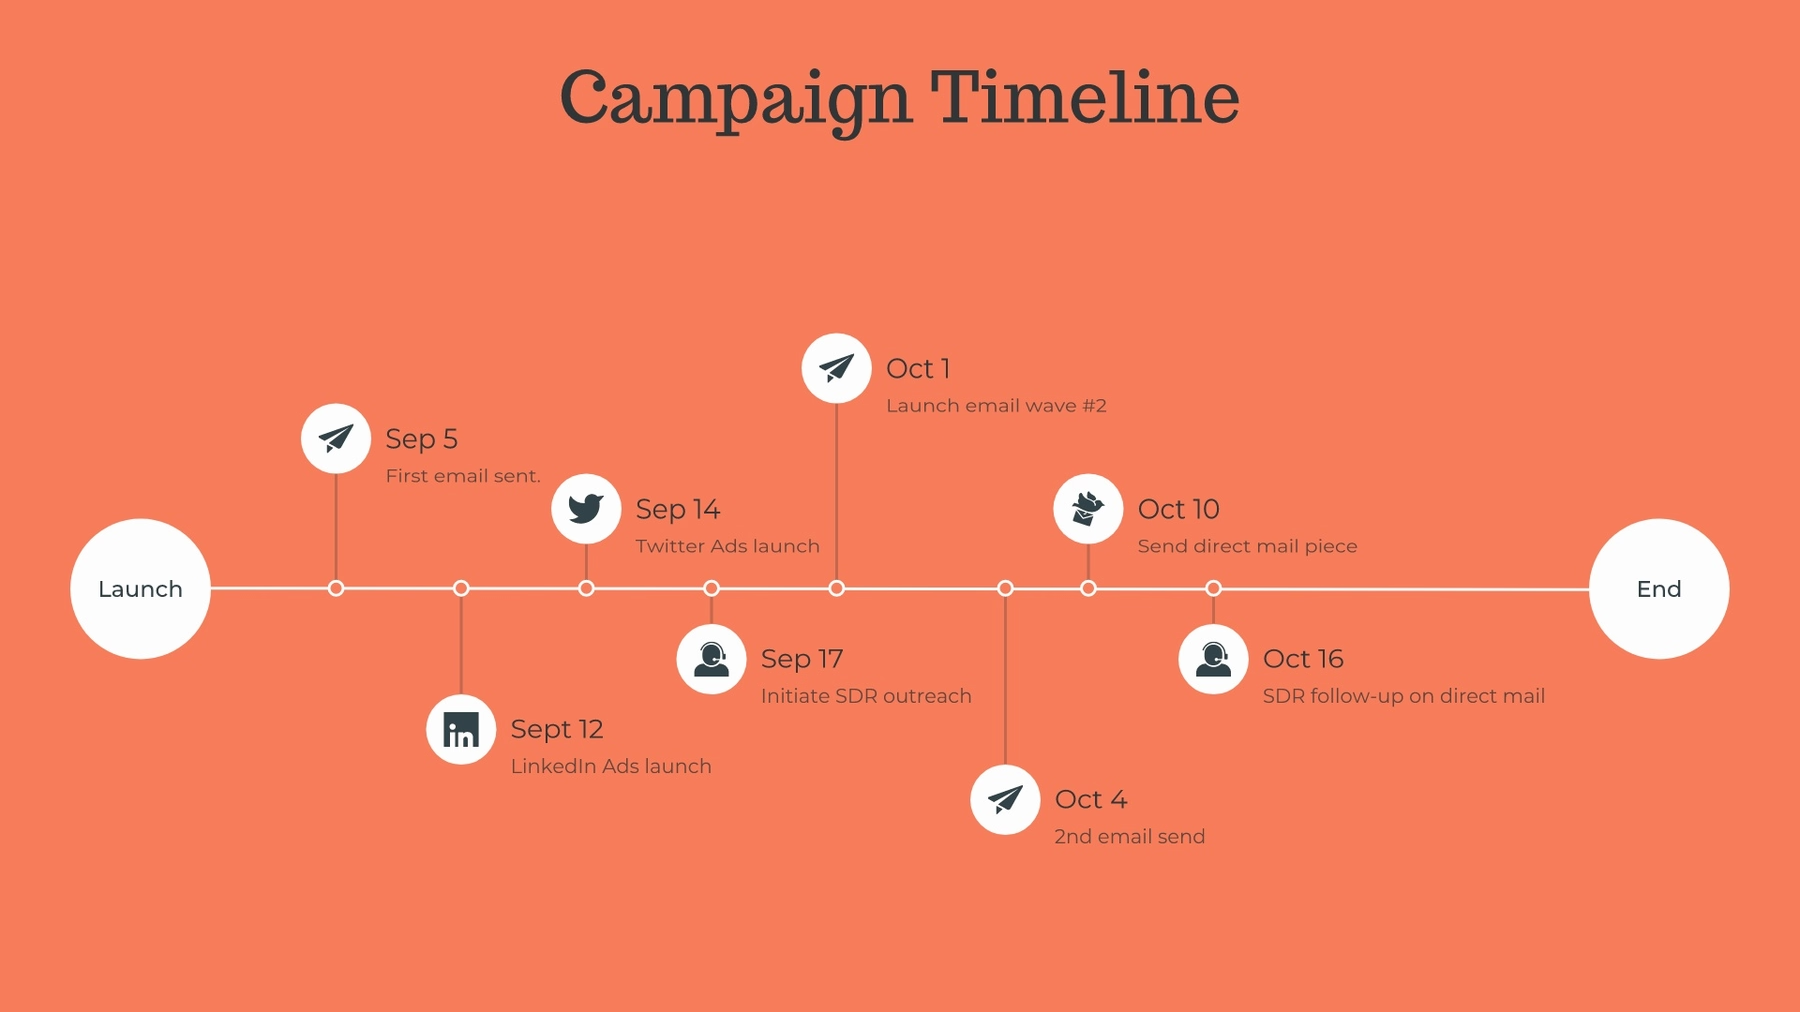
Timeline
A timeline is a visual representation marking all major events over a period of time. Timeline slides have many versatile uses—everything from project plans, to status updates, to “next steps” can be communicated using a timeline. They are most often used for business purposes, but can also be useful for better illustrating scientific and other highly technical processes.
Timeline slides help us to conceptualize past, present and future events. If you want to give your audience confidence that a plan or a process has been thoroughly vetted and is well-articulated, a timeline is very effective.
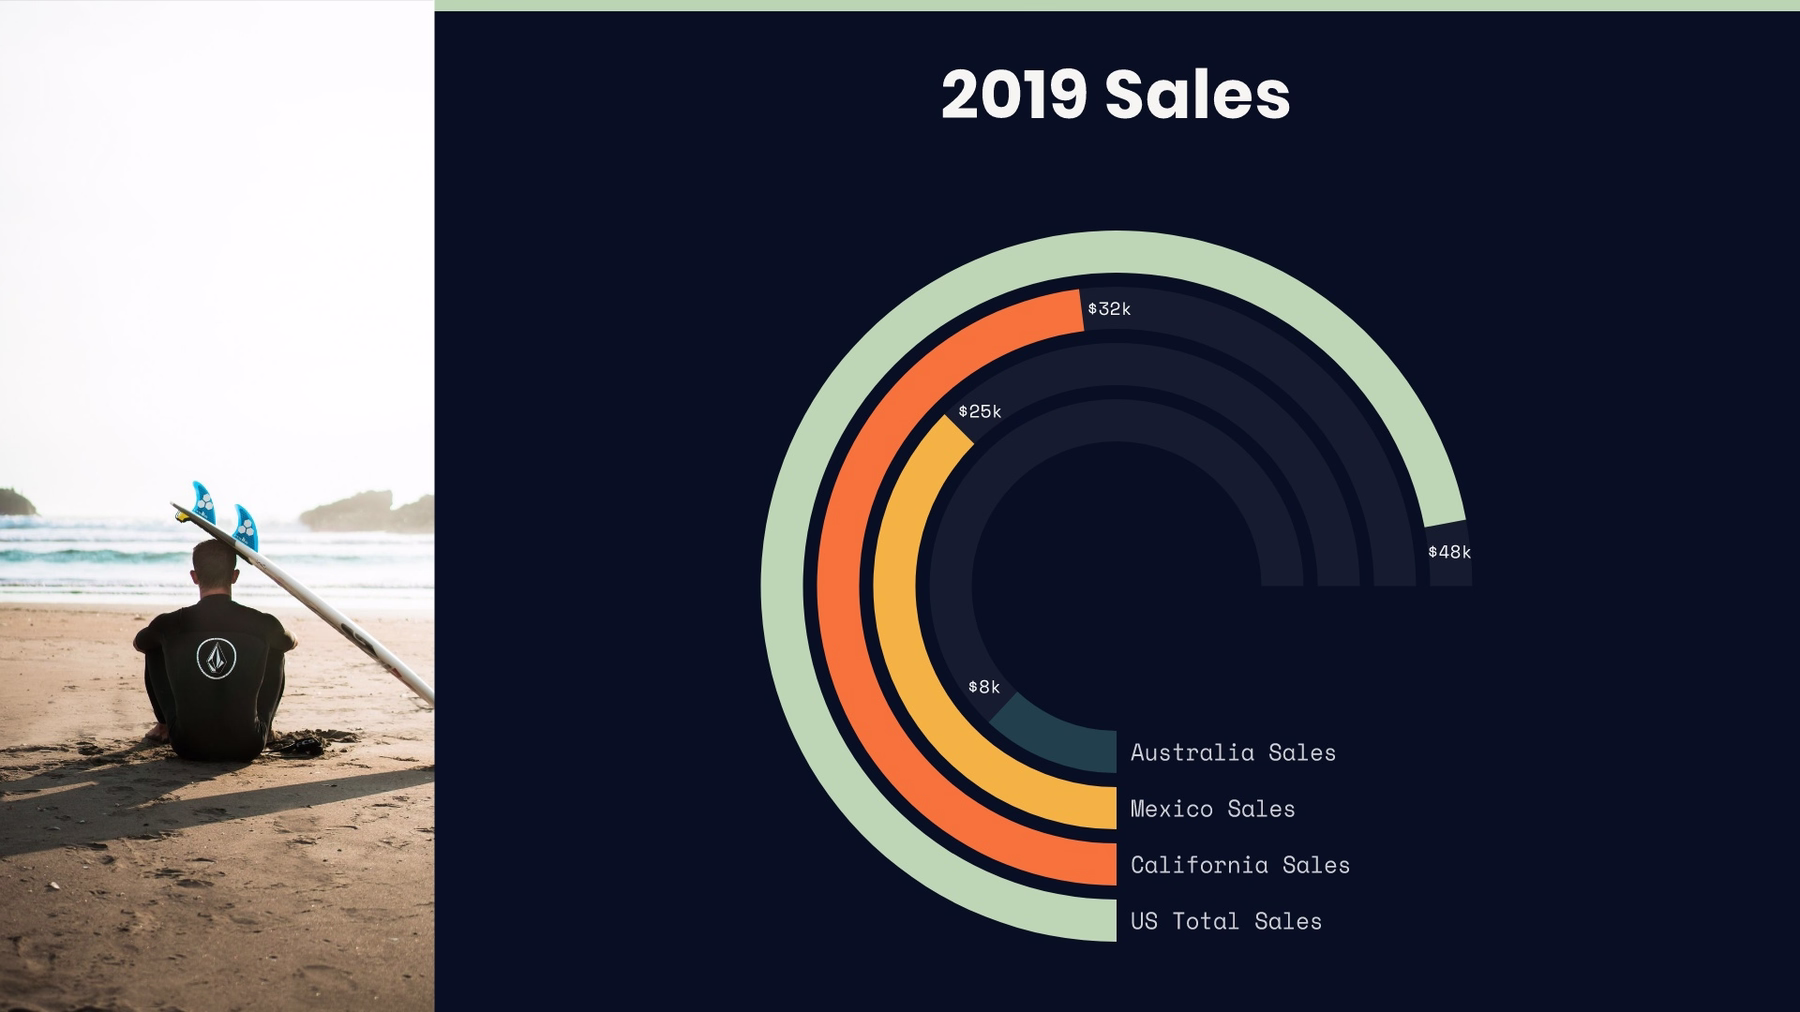
Radial Bar
For a visually interesting twist on a plain bar chart, add a radial bar chart slide to your presentation. Our data comparison template is similar to a bar graph, using bars of varying lengths to display measured data. The data comparison template, however, displays percentages instead of exact numbers. One of the best things about using our data comparison slide? You can customize it for your presentation. Create a horizontal or vertical slide, remove or add grid lines, play with its design, and more.
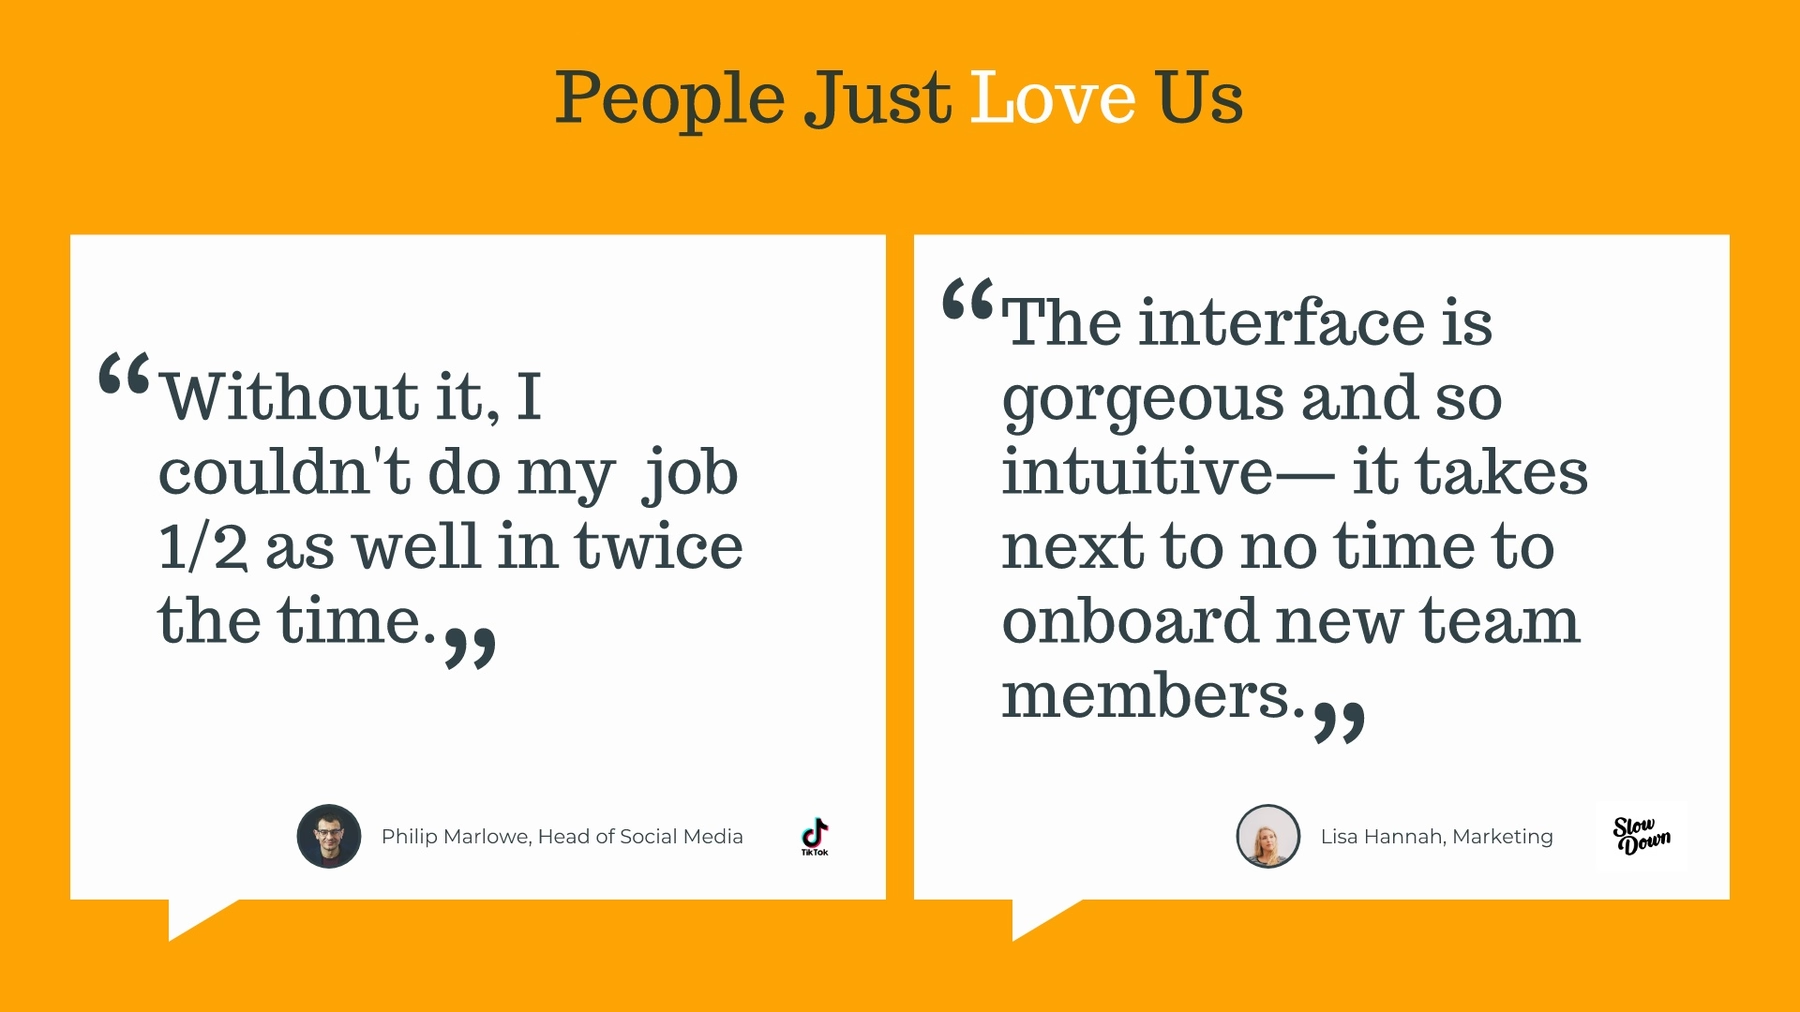
Quotes
Do you have a relevant, meaningful quote to add to your presentation, but you’re not sure where to put it? Give your quote its own slide using our quotation template. Quotes can add credibility and opinions from an expert to back up your presentation. It can also inspire and stir up emotion in your audience. When used correctly, a quotation template can be a thought provoking and fresh moment in your presentation.
Team Members
A team slide is a visual depiction of the members of your team. It should include photos, names, job titles, and can even include information about your team’s credentials or past experience. An effective team slide makes it simple for your audience to easily connect everyone involved with their role in the project.
Our team templates provide the tools required to add each component of your team slides with ease. Whether you’re sharing your slides with investors, upper management, consumers, or peers, everyone involved will know who is who, and what you do.

Start inspired. Log in and check out our full inspiration gallery.


.gif)